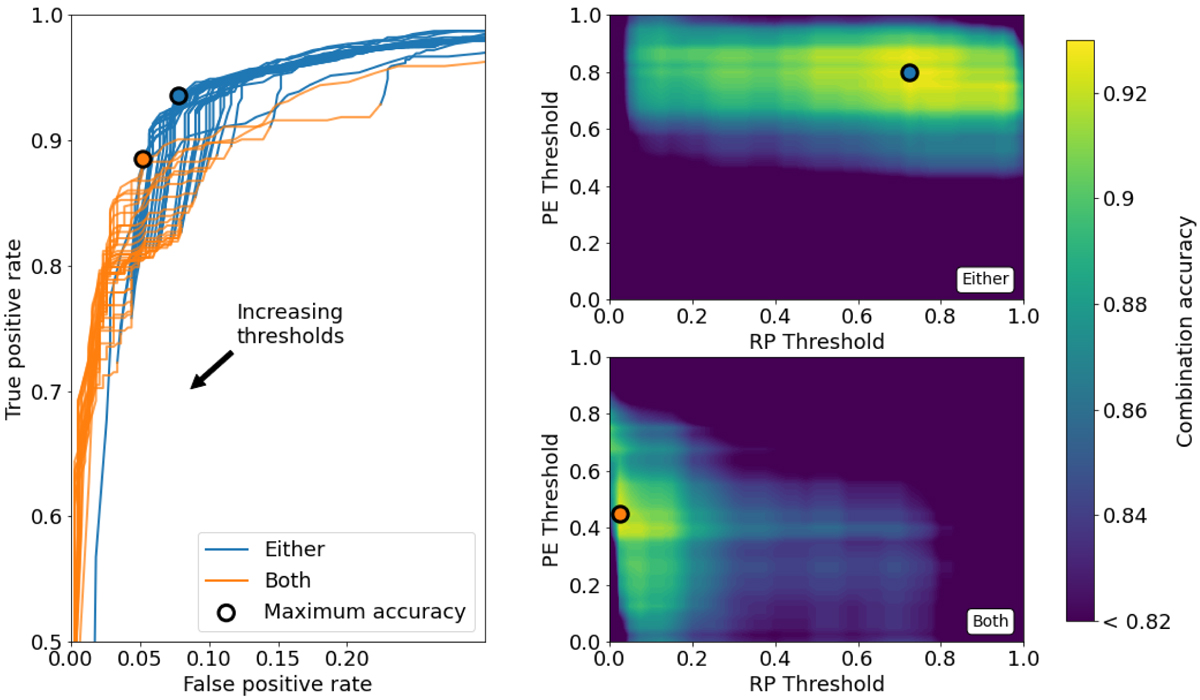
Fig. 7
Download original image
Performance summary for the PE and RP methods. Left frame: the TP rate and the FP rate for the different combinations of the PE and RP thresholds. The detection thresholds for both methods generally increase going from the high TP and FP range to toward low TP and FP. The two sets of curves denote TP and FP values when the requirement is that either (blue) or both (orange) the PE or RP method yields a threshold crossing. For TP < 0.5 the curves tend toward FP = 0, and similarly for FP > 0.2 they tend toward TP = 1. Right frames: the accuracy of the PE and RP methods under the two conditions. The circled dots show the values for the thresholds that maximize the accuracy of the methods under the two conditions.
Current usage metrics show cumulative count of Article Views (full-text article views including HTML views, PDF and ePub downloads, according to the available data) and Abstracts Views on Vision4Press platform.
Data correspond to usage on the plateform after 2015. The current usage metrics is available 48-96 hours after online publication and is updated daily on week days.
Initial download of the metrics may take a while.