Free Access
Fig. 3
Download original image
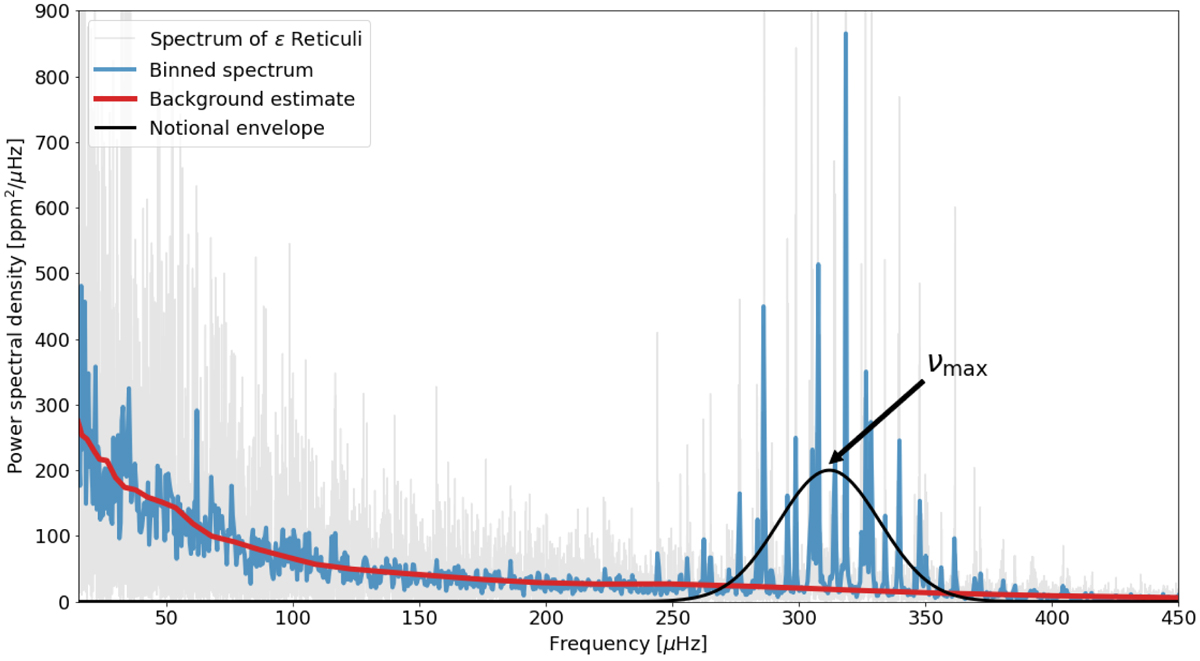
Example power spectrum of ϵ Reticuli (TIC198079199) shown in gray, with the spectrum binned to 0.2 µHz in blue. The estimate of the correlated and white noise background is shown in red. The power in the p-mode envelope is distributed approximately according to a Gaussian (black) centered on vmax.
Current usage metrics show cumulative count of Article Views (full-text article views including HTML views, PDF and ePub downloads, according to the available data) and Abstracts Views on Vision4Press platform.
Data correspond to usage on the plateform after 2015. The current usage metrics is available 48-96 hours after online publication and is updated daily on week days.
Initial download of the metrics may take a while.