Fig. 9.
Download original image
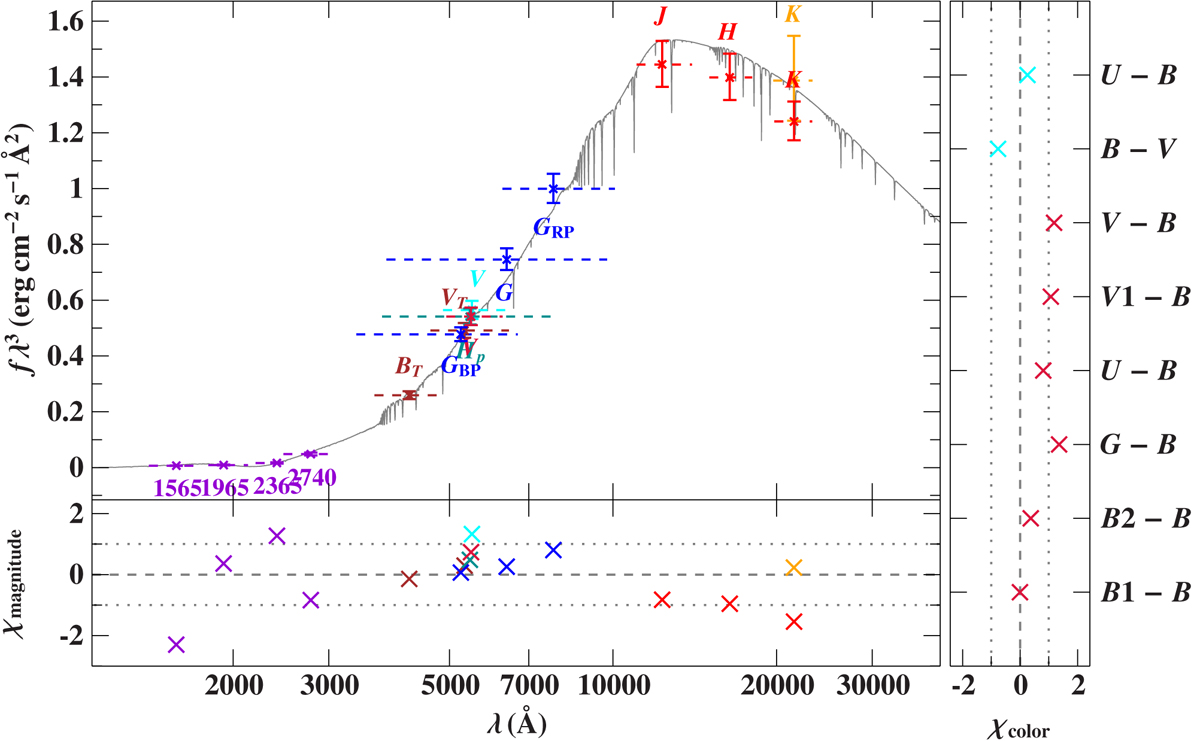
Comparison of synthetic and observed photometry for HIP 91599. The top panel displays the spectral energy distribution. The colored data points are filter-averaged fluxes that were converted from observed magnitudes. The dashed horizontal lines depict the full widths at 10% of the maximum of the filter transmissions, while the solid gray line represents the best fitting model (spectral resolution of 6 Å). In order to reduce the steep slope of the SED the flux is multiplied by the wavelength to the power of three. Bottom panel: residuals, χ: differences between synthetic and observed magnitudes divided by the corresponding uncertainties. The photometric systems have the following color code: UV magnitudes from the TD1 satellite (violet; Nandy et al. 1978) labeled with central wavelengths, optical magnitudes from Tycho2 (Høg et al. 2000), HIPPARCOS (van Leeuwen 2007), Gaia (blue Gaia Collaboration 2020), and Mermilliod (2006); IR photometry from 2MASS (red Cutri et al. 2003) and DENIS (yellow Denis 2005). Right hand panel: color indices in the Johnson (cyan) and Geneva (red) systems (Mermilliod 2006; Rufener 1988).
Current usage metrics show cumulative count of Article Views (full-text article views including HTML views, PDF and ePub downloads, according to the available data) and Abstracts Views on Vision4Press platform.
Data correspond to usage on the plateform after 2015. The current usage metrics is available 48-96 hours after online publication and is updated daily on week days.
Initial download of the metrics may take a while.