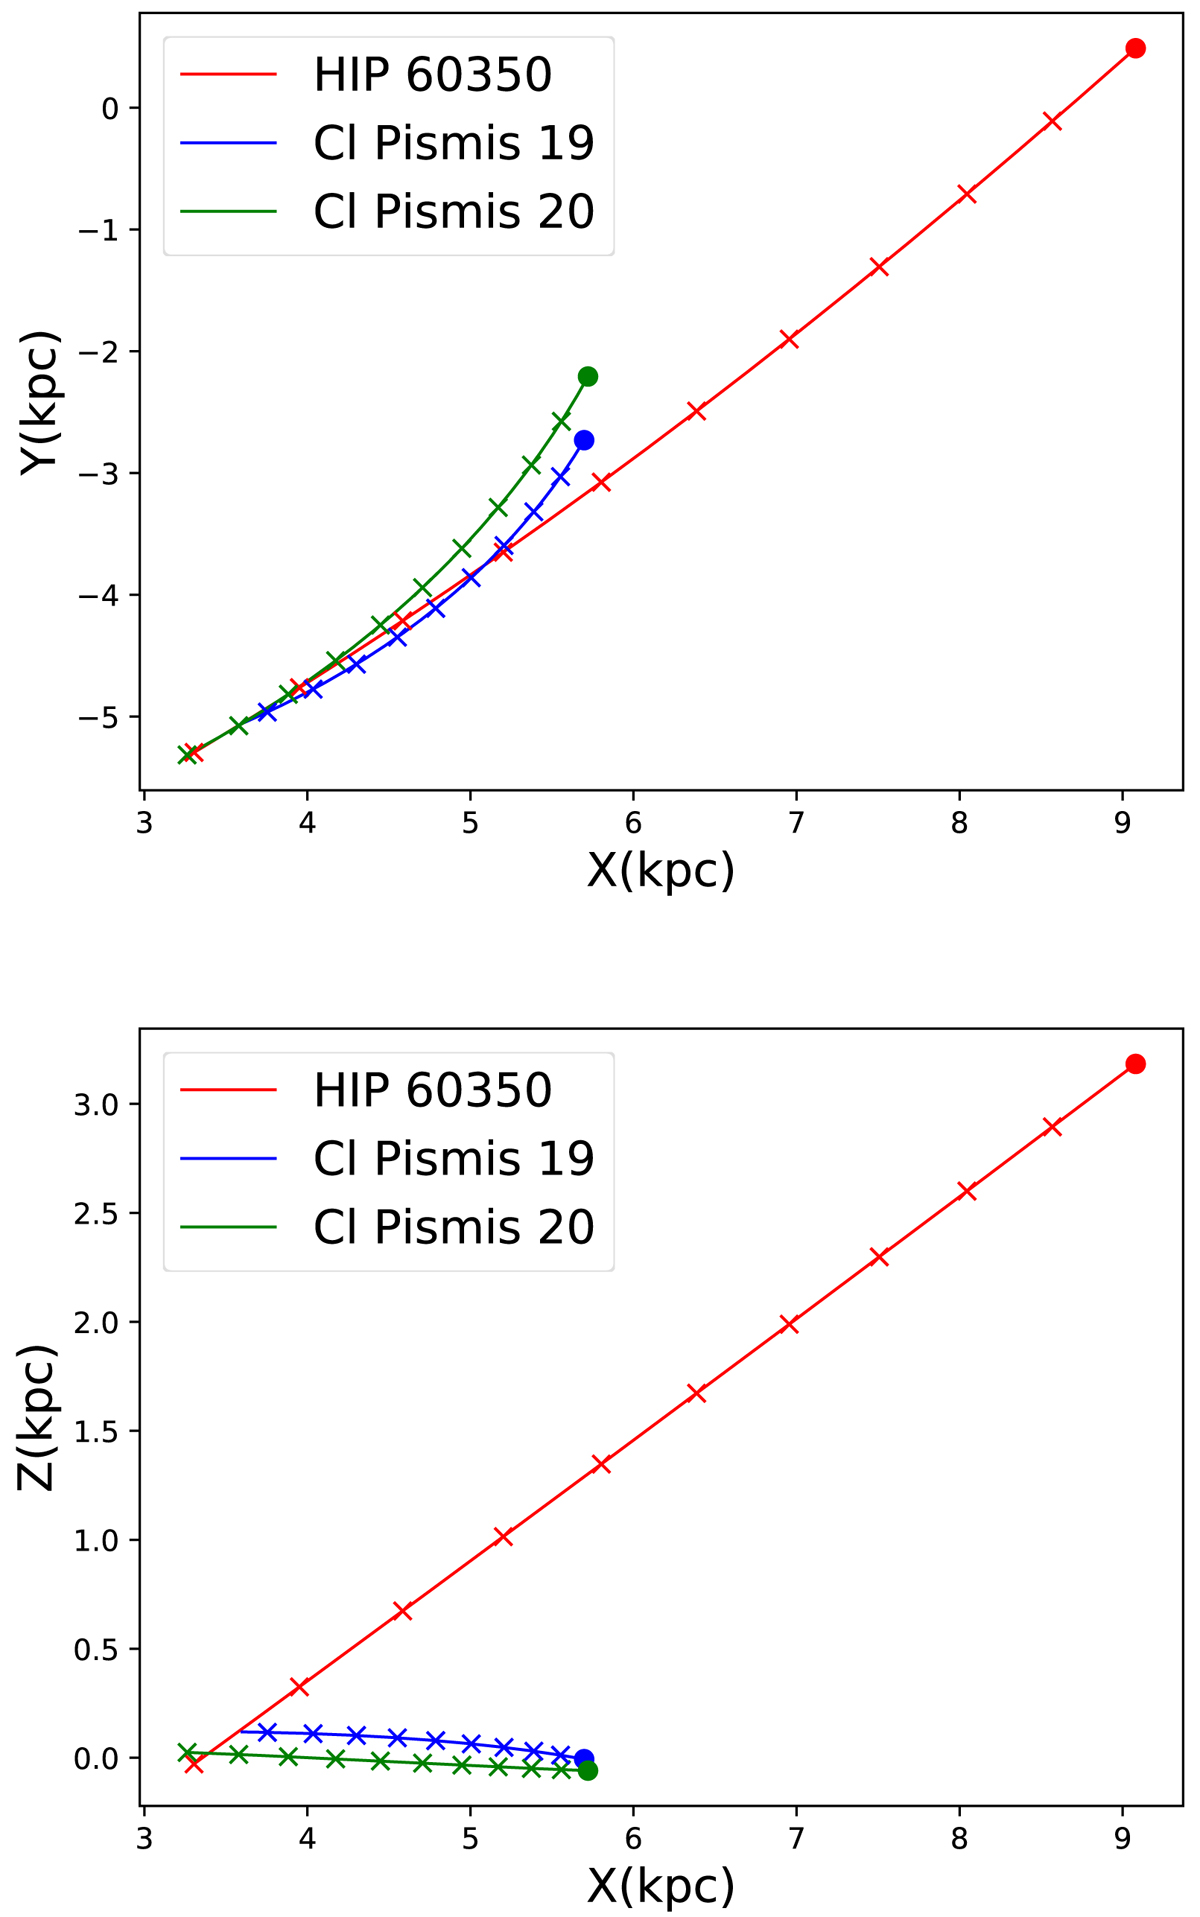
Fig. 12.
Download original image
The 3 dimensional orbit of the star HIP 60350 shown here in X–Y and X–Z Cartesian coordinates. The two clusters Cl Pismis 19 and Cl Pismis 20 are also plotted for 14.3 and 14.9 Myr respectively. Crosses represent 1.5 Myr in time while circles represent the present day positions. Trajectories are plotted using the revised halo potential of Model I from Irrgang et al. (2013) in Galpy (Bovy 2015).
Current usage metrics show cumulative count of Article Views (full-text article views including HTML views, PDF and ePub downloads, according to the available data) and Abstracts Views on Vision4Press platform.
Data correspond to usage on the plateform after 2015. The current usage metrics is available 48-96 hours after online publication and is updated daily on week days.
Initial download of the metrics may take a while.