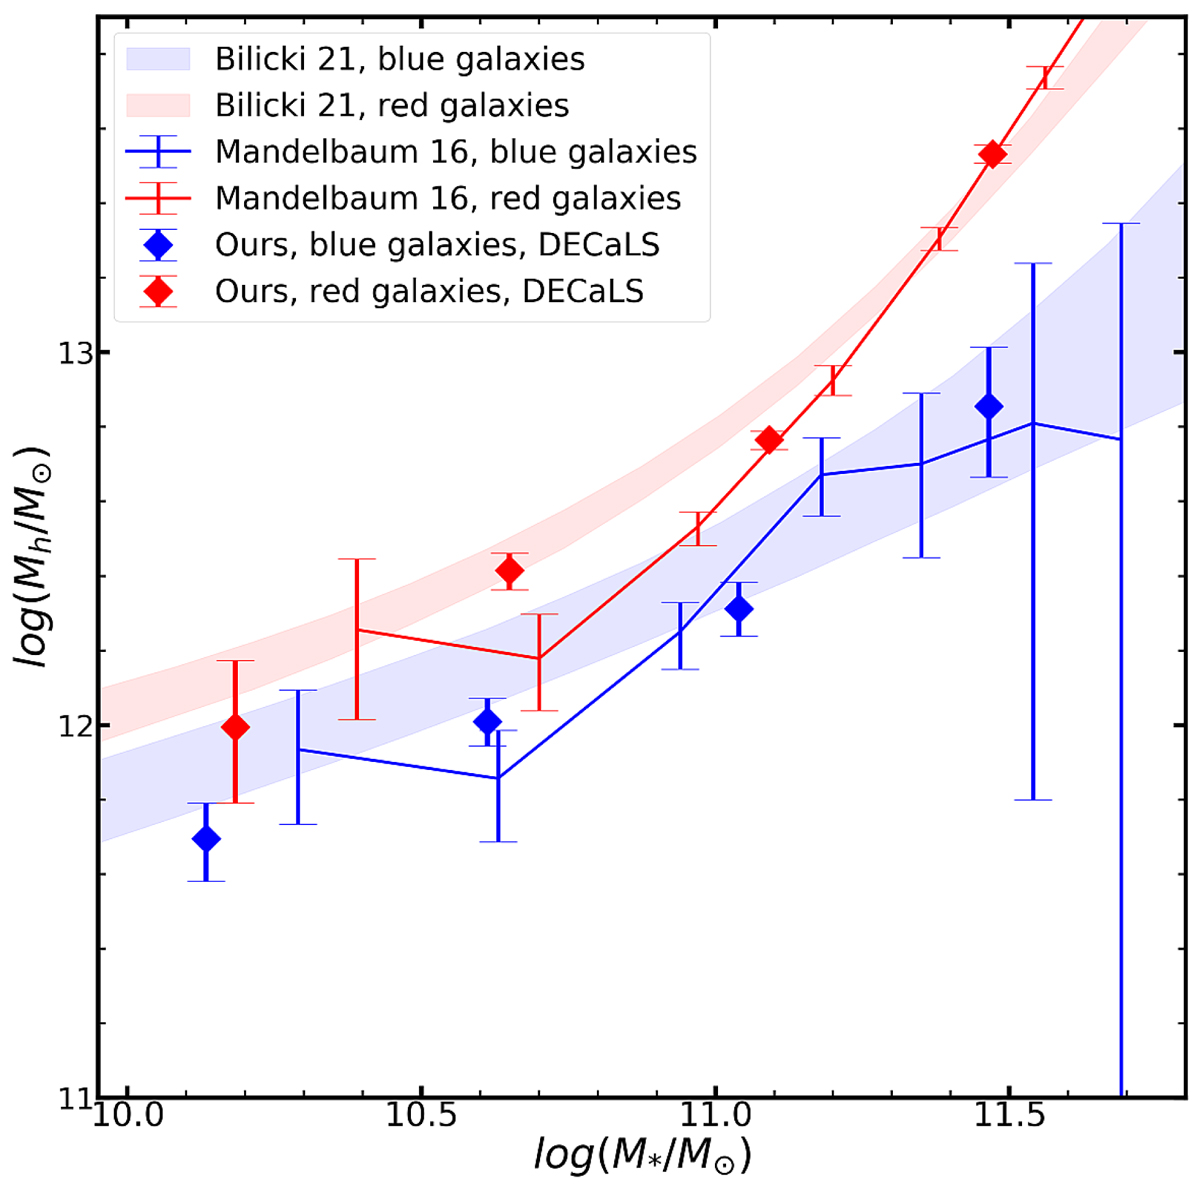
Fig. 7.
Download original image
Comparison of our SHMR with those of Mandelbaum et al. (2016) and Bilicki et al. (2021). The diamonds, the lines with error bars, and the shaded regions are the SHMRs from our results, Mandelbaum et al. (2016), and Bilicki et al. (2021), respectively. The solid symbols show the results calculated using the DECaLS shear catalog. The red and blue represent the red and blue galaxy samples, respectively.
Current usage metrics show cumulative count of Article Views (full-text article views including HTML views, PDF and ePub downloads, according to the available data) and Abstracts Views on Vision4Press platform.
Data correspond to usage on the plateform after 2015. The current usage metrics is available 48-96 hours after online publication and is updated daily on week days.
Initial download of the metrics may take a while.