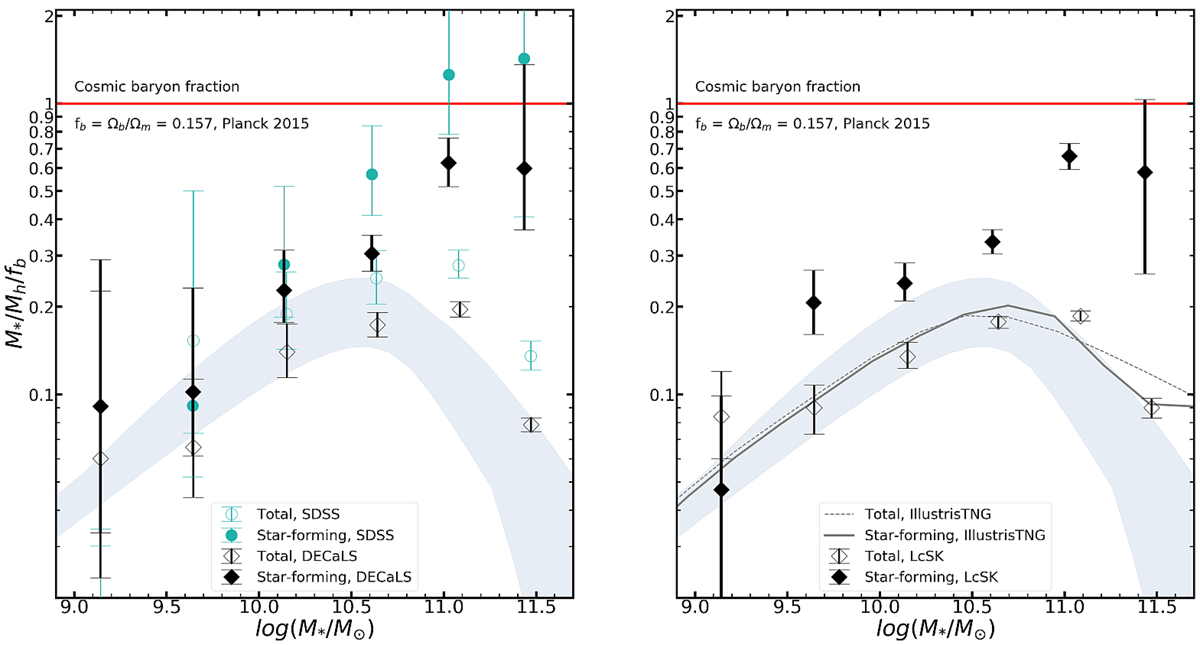
Fig. 5.
Download original image
Baryon conversion efficiency as a function of stellar mass. In the left panel, the symbols with error bars show the efficiency calculated using the halo mass obtained from the fits to the stacked lensing mass profiles. The black symbols show the results from the DECaLS shear catalog, while the green ones are obtained from the SDSS shear catalog (see Appendix C). The solid and open symbols show the results for the star-forming and total populations, respectively. Error bars indicate the 16% and 84% of the posterior distribution obtained from the MCMC fitting. In the right panel, the symbols with error bars show the efficiency calculated using the LcSK method. The error bars reflect the 16% and 84% of the posterior distribution obtained from the LcSK. The solid (dashed) gray lines show the results for star-forming (total) galaxies in the hydro-simulation IllustrisTNG. The shadow region in the two panels covers the range obtained before, as in Fig. 4.
Current usage metrics show cumulative count of Article Views (full-text article views including HTML views, PDF and ePub downloads, according to the available data) and Abstracts Views on Vision4Press platform.
Data correspond to usage on the plateform after 2015. The current usage metrics is available 48-96 hours after online publication and is updated daily on week days.
Initial download of the metrics may take a while.