Fig. 3.
Download original image
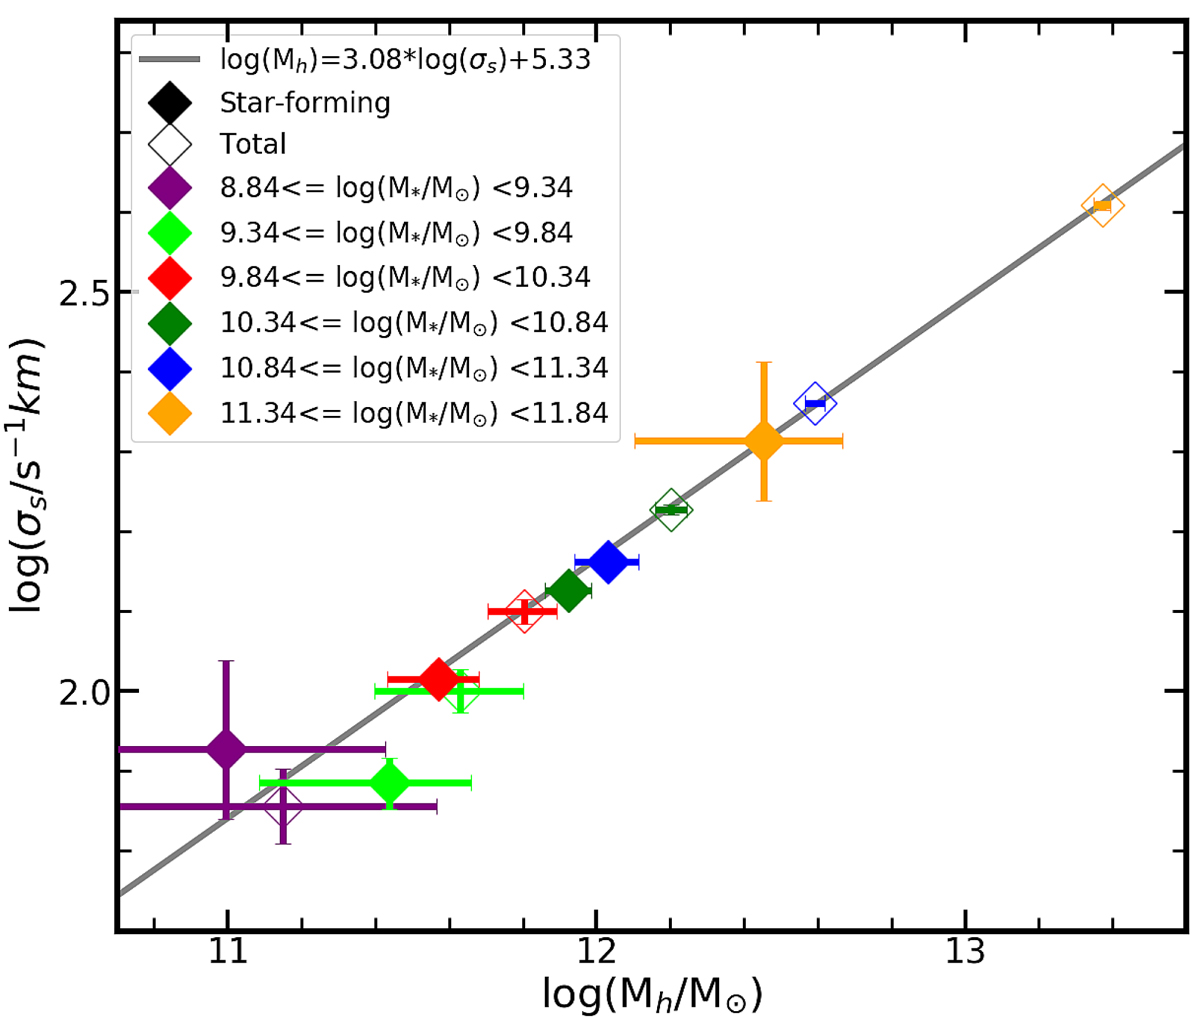
Halo mass–satellite velocity dispersion relation. The open (solid) diamonds show the velocity dispersion (σs) of satellites versus the host halo masses for total (star-forming) central galaxies. The halo masses are measured from DECaLS lensing data. Different colors indicate different stellar mass bins of central galaxies. The error bars for halo mass indicate the 16% and 84% of the posterior distribution obtained from the MCMC fitting to the stacked lensing profiles. The error bars for σs represent the 16% and 84% of the posterior distribution obtained from the fitting to the distribution of the satellite-central velocity difference. The solid line represents the best fit to the data points for the total galaxy sample.
Current usage metrics show cumulative count of Article Views (full-text article views including HTML views, PDF and ePub downloads, according to the available data) and Abstracts Views on Vision4Press platform.
Data correspond to usage on the plateform after 2015. The current usage metrics is available 48-96 hours after online publication and is updated daily on week days.
Initial download of the metrics may take a while.