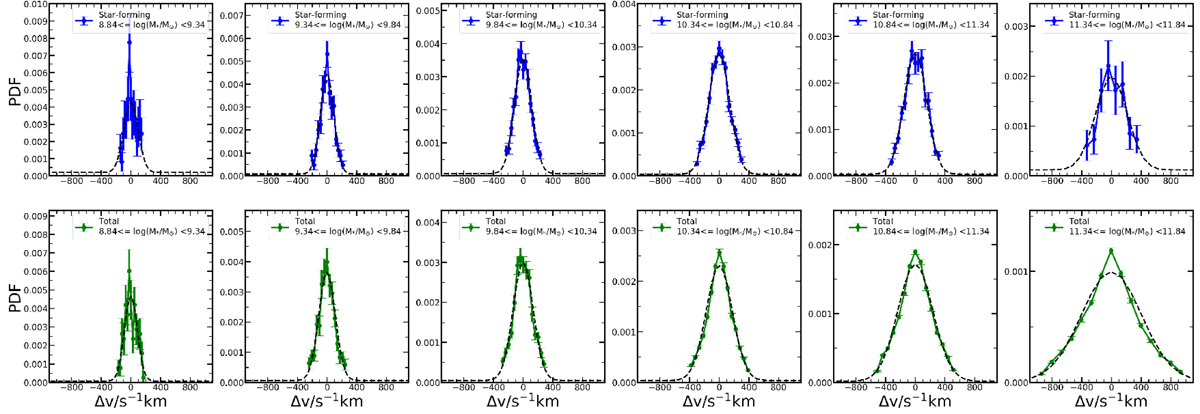
Fig. 2.
Download original image
Distribution of the line-of-sight velocity difference (Δv) between central galaxies and their satellite candidates. The solid lines with error bars show the PDF of Δv. The dashed lines show the Gaussian-plus-a-constant fits to the data points. The error bars correspond to the standard deviation of 100 bootstrap samples. The upper row shows the results for star-forming centrals, while the lower row is for the total central population. The results of the star-forming and total samples in different stellar mass bins are shown in different columns. We note that the scales of the vertical axes are different for different panels.
Current usage metrics show cumulative count of Article Views (full-text article views including HTML views, PDF and ePub downloads, according to the available data) and Abstracts Views on Vision4Press platform.
Data correspond to usage on the plateform after 2015. The current usage metrics is available 48-96 hours after online publication and is updated daily on week days.
Initial download of the metrics may take a while.