Open Access
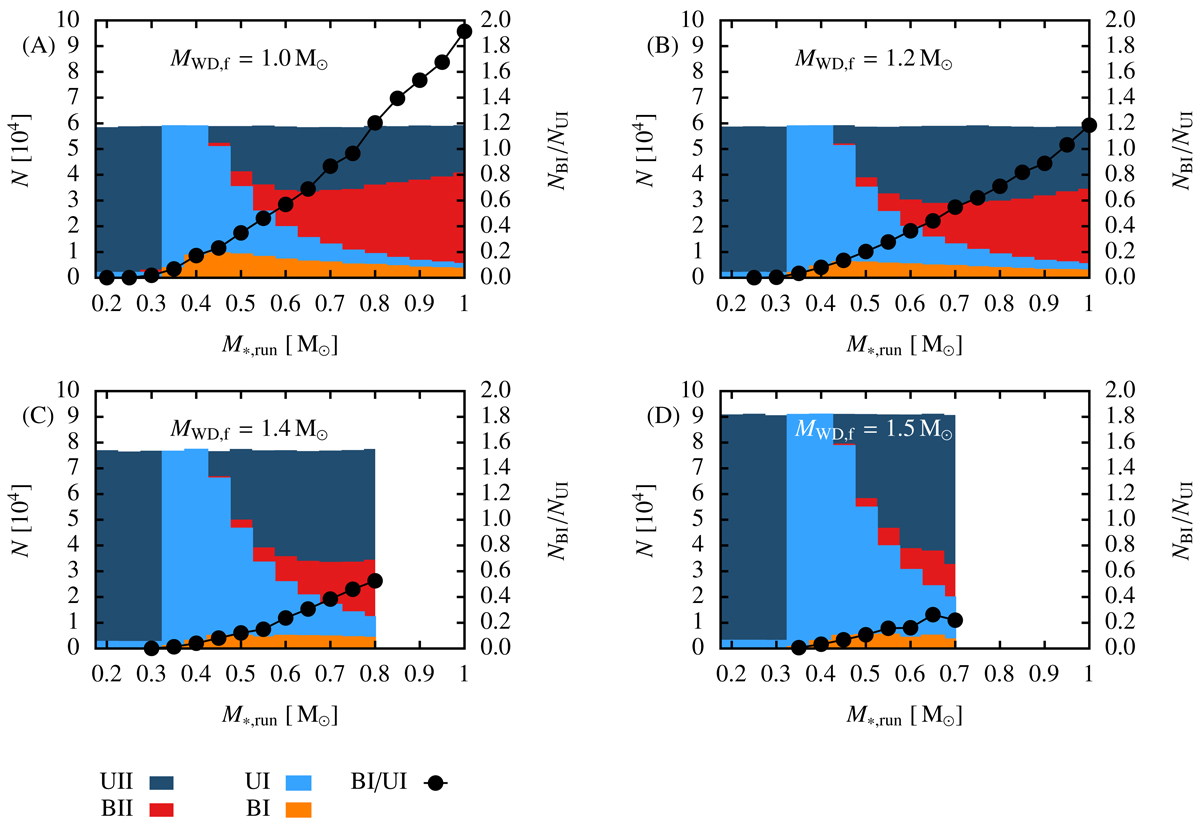
Fig. 8.
Download original image
Spectral distribution of subpopulation membership over terminal donor mass for the M10, M12, M14 and M15 populations for the total set (not merely the fiducial volume). Total numbers per mass at measured against the left hand y-axis. The black line indicates the BI/UI and is measured against the right hand y-axis.
Current usage metrics show cumulative count of Article Views (full-text article views including HTML views, PDF and ePub downloads, according to the available data) and Abstracts Views on Vision4Press platform.
Data correspond to usage on the plateform after 2015. The current usage metrics is available 48-96 hours after online publication and is updated daily on week days.
Initial download of the metrics may take a while.