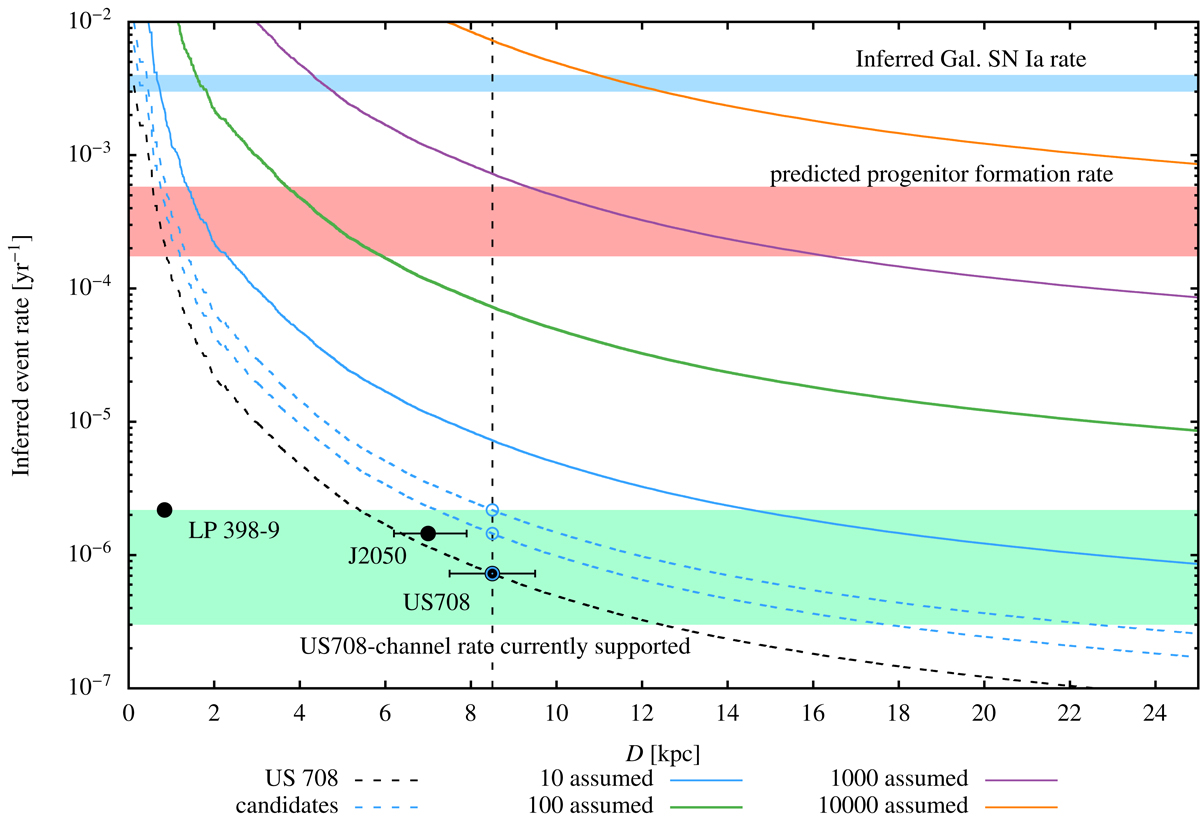
Fig. 23.
Download original image
Calculated event rates for the production of population members. Dashed lines indicate the distance-dependent event rate based on the three observed candidates. Solid lines indicate event rates under the assumption of the indicated number of detections. Distances to the observed objects (including error bars) and associated event rates are indicated by filled and hollow circles. The error bars for LP 398-9 are smaller than the radius of the circles. Upper and lower limits for the observationally supported event rate, predicted formation rate of putative progenitor systems and the inferred Galactic SN Ia rate are as indicated. For details on calculation see text.
Current usage metrics show cumulative count of Article Views (full-text article views including HTML views, PDF and ePub downloads, according to the available data) and Abstracts Views on Vision4Press platform.
Data correspond to usage on the plateform after 2015. The current usage metrics is available 48-96 hours after online publication and is updated daily on week days.
Initial download of the metrics may take a while.