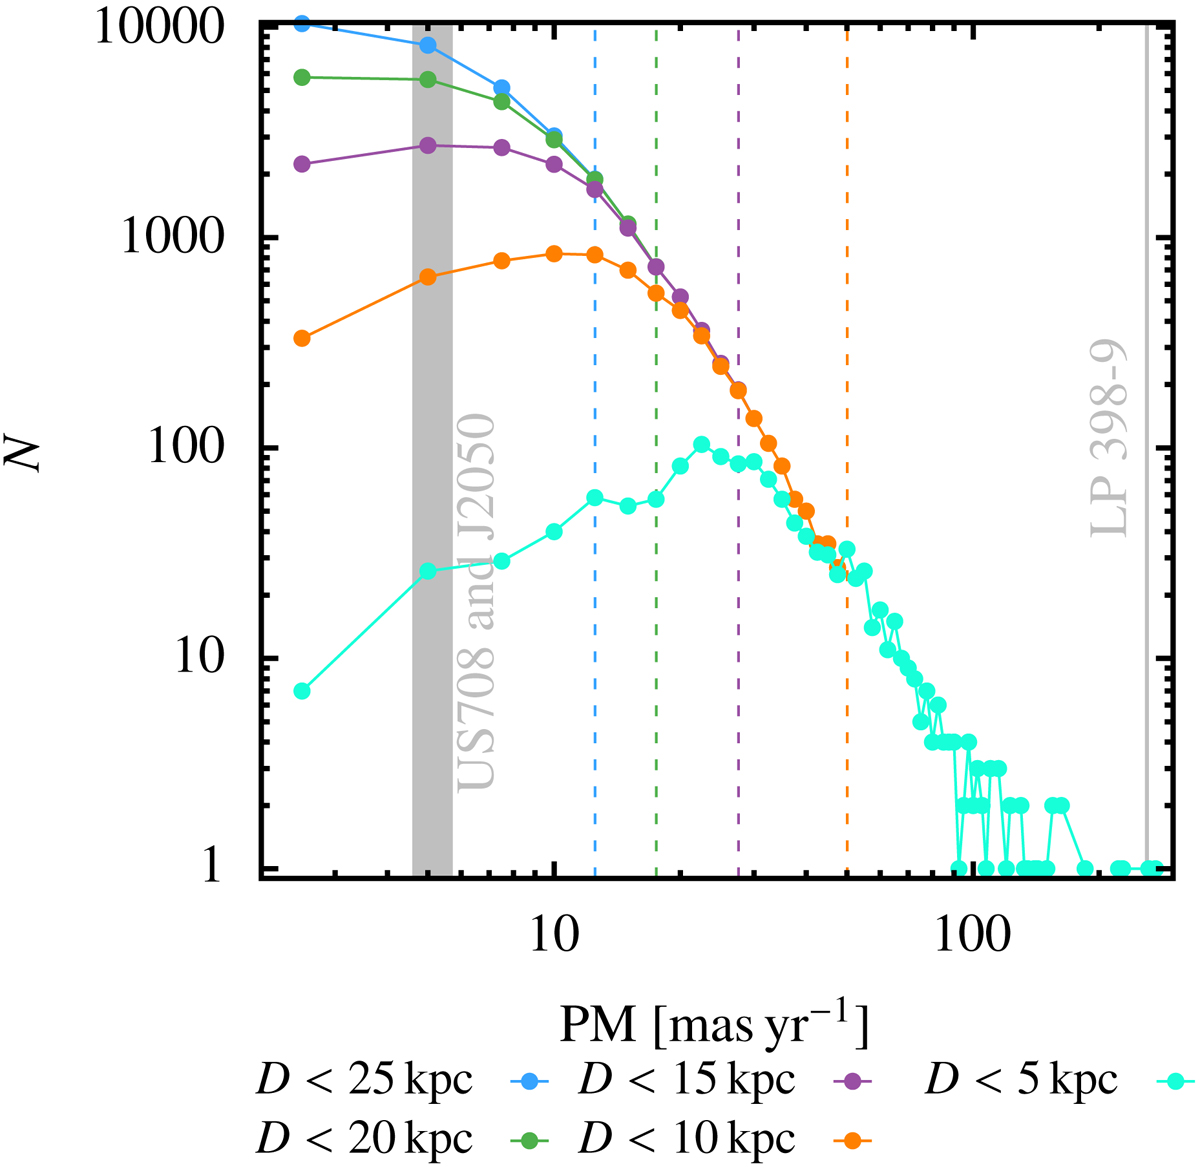
Fig. 20.
Download original image
Spectral diagram of the total proper motion of the predicted population for the M14 population. Lines of different colours indicate different distance-limited sub-samples. Dashed lines indicate where the distance-limited sub-sample of the same colour is the same as the next smaller limited sub-sample. Grey areas indicate the proper motion of the three population candidates as labelled. The PMs of US 708 and J2050 relatively similar, so their corresponding lines were unified for legibility. Proper motion errors are of the order of ∼ ± 0.2 mas yr−1 for US 708 and J2050 and ∼ ± 0.1 mas yr−1 for LP 398-9 (Gaia Collaboration 2021).
Current usage metrics show cumulative count of Article Views (full-text article views including HTML views, PDF and ePub downloads, according to the available data) and Abstracts Views on Vision4Press platform.
Data correspond to usage on the plateform after 2015. The current usage metrics is available 48-96 hours after online publication and is updated daily on week days.
Initial download of the metrics may take a while.