Open Access
Fig. 19.
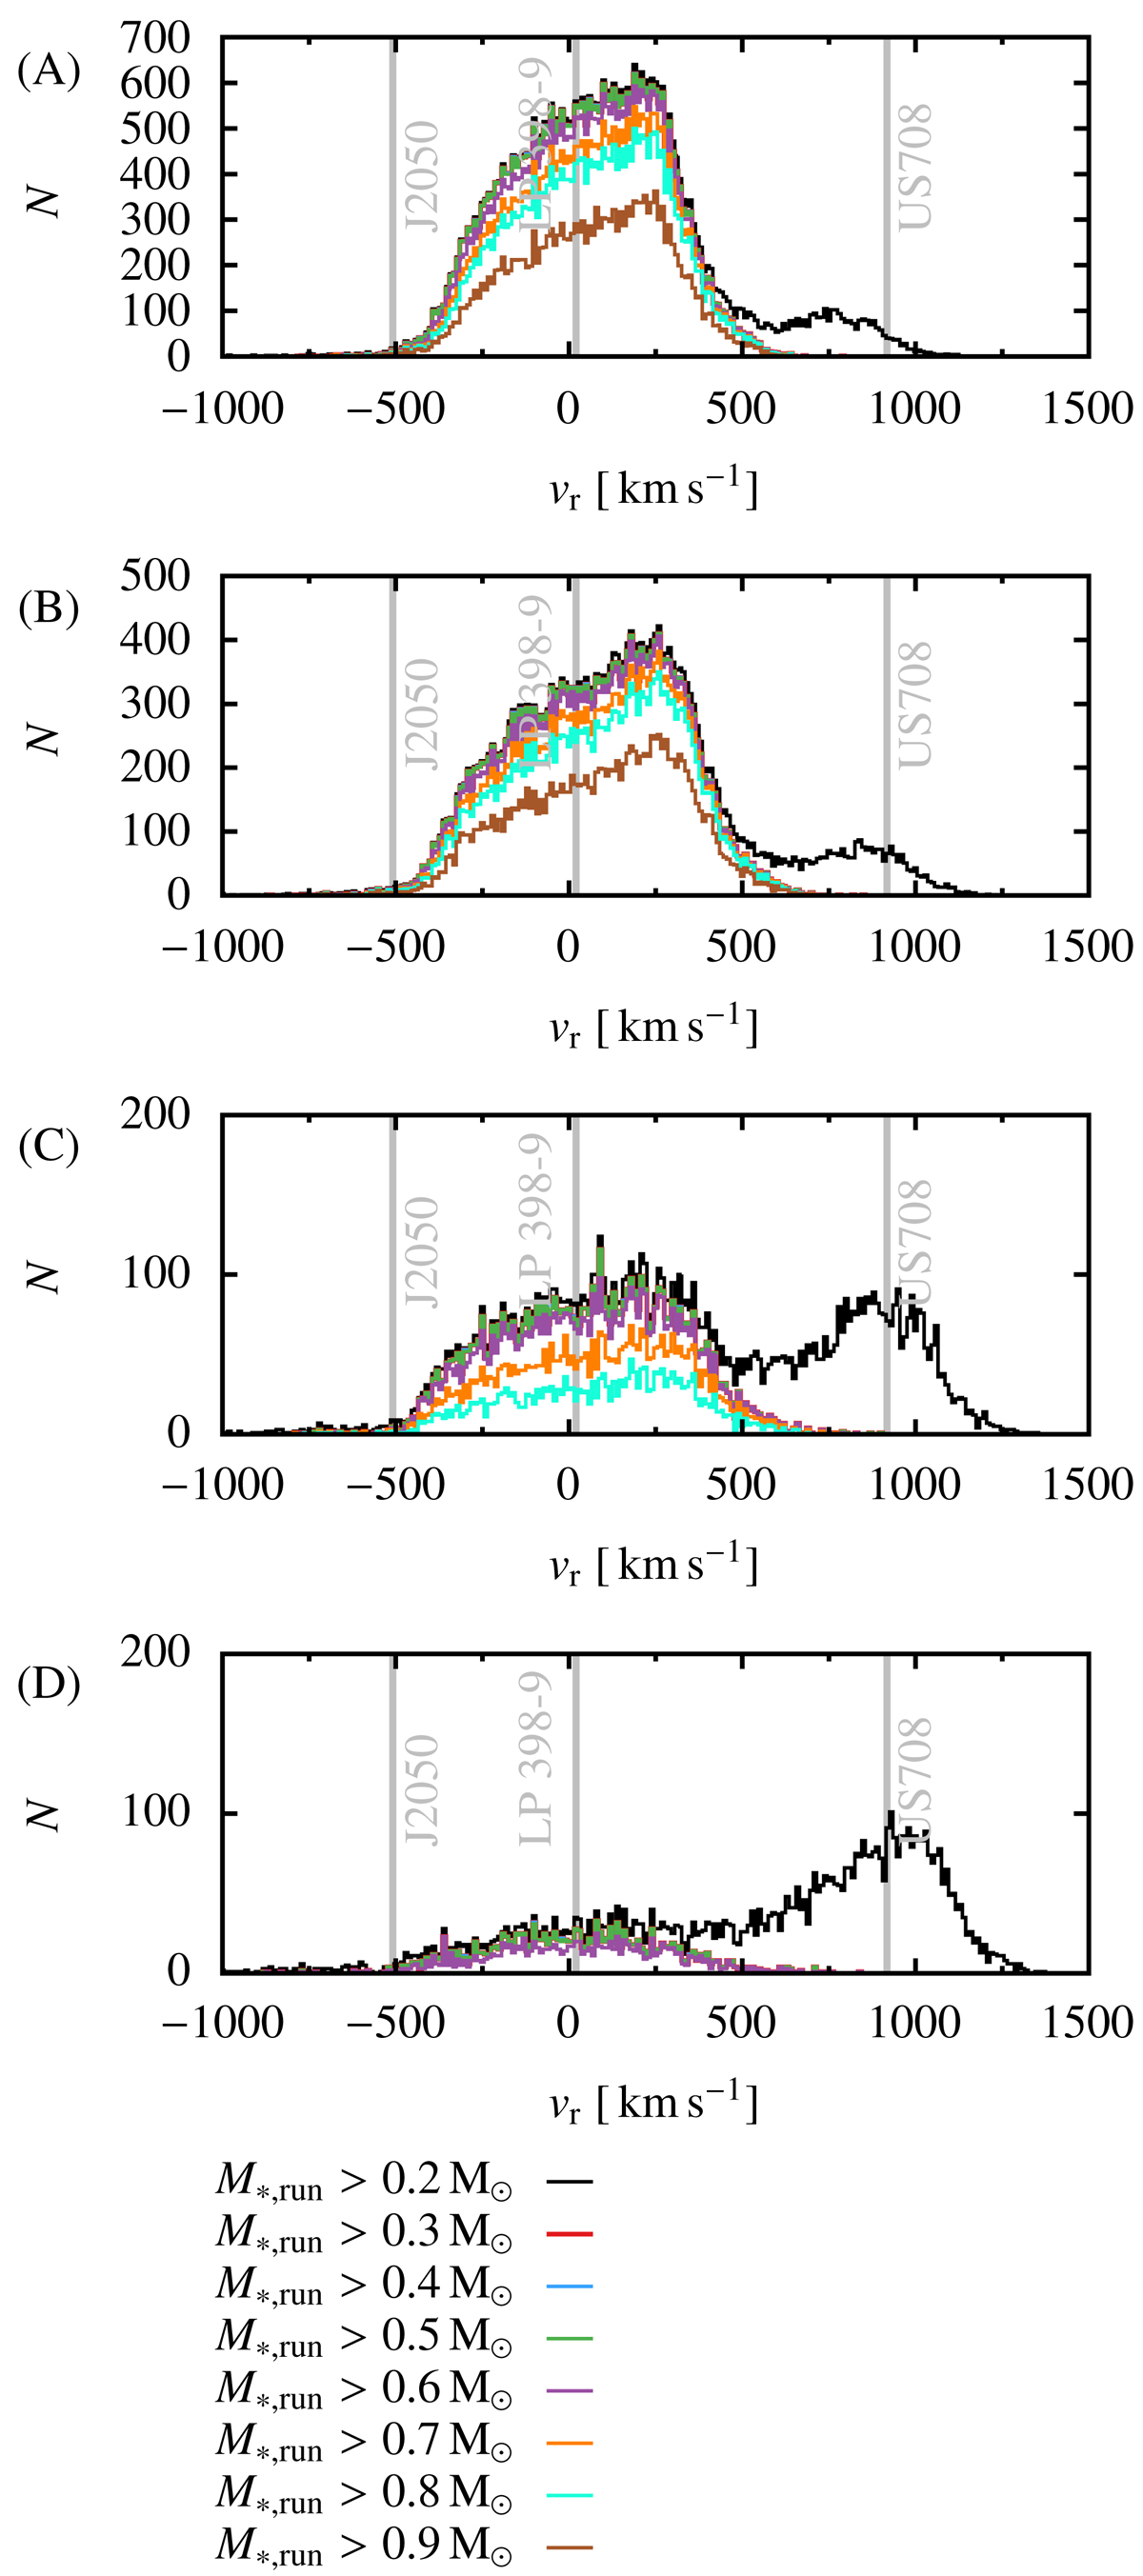
Download original image
Like Fig. 18, but for the UII+BII subpopulation. Each line indicates the sum over all masses higher than indicated in the key; The secondary peak at about 750 km s−1 indicates the peak of the low mass UII population. The lifetimes of stars in the range 0.3−0.45 M⊙ are too long to contribute to this plot.
Current usage metrics show cumulative count of Article Views (full-text article views including HTML views, PDF and ePub downloads, according to the available data) and Abstracts Views on Vision4Press platform.
Data correspond to usage on the plateform after 2015. The current usage metrics is available 48-96 hours after online publication and is updated daily on week days.
Initial download of the metrics may take a while.