Fig. 10.
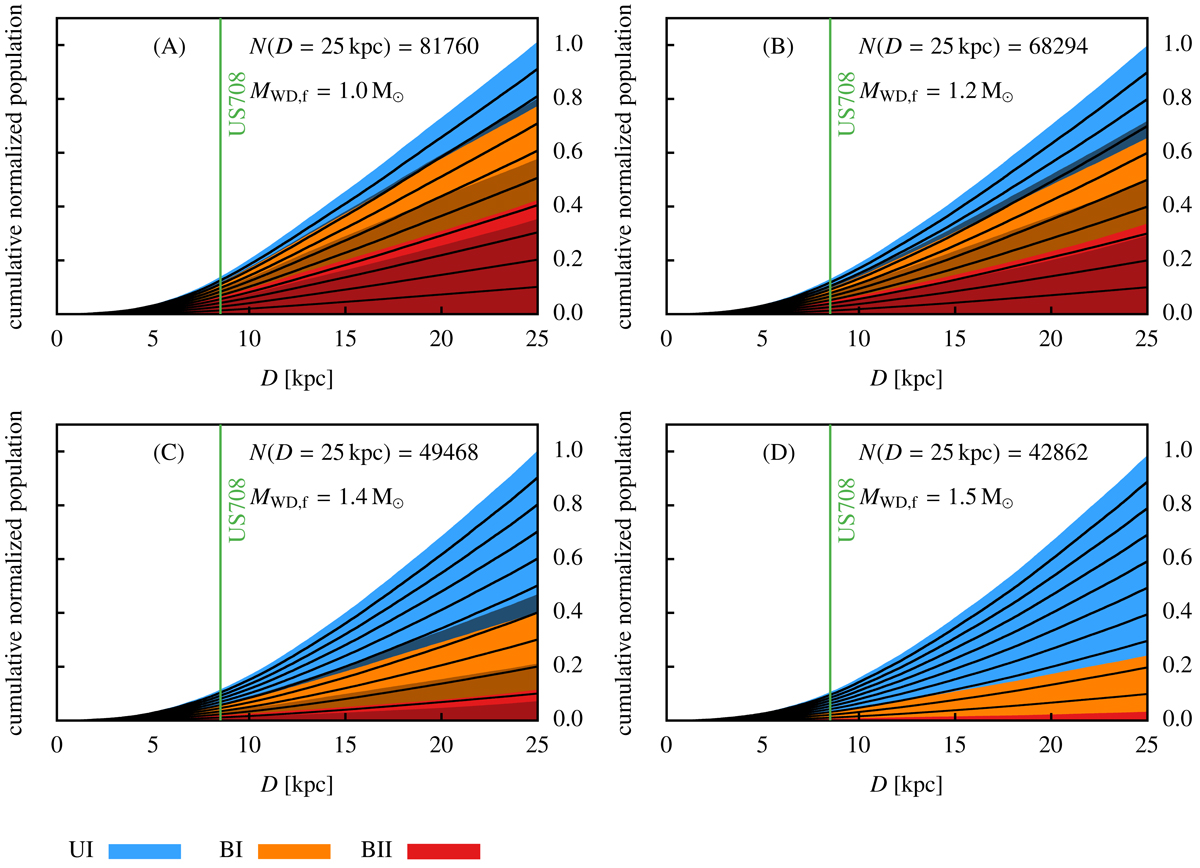
Download original image
Cumulative distance distribution of runaway stars normalised to the total number of runaways in a non-degenerate state, Ntot, n − d for a ejection frequency of fej = 1/300 yr−1. The blue and orange curves add up to unity, with blue indicating the relative abundance of the UI subpopulation and orange represents the BI subpopulation. Red indicates the BII subpopulation normalised to the UI+UII subpopulation. Dark orange and dark red indicate the admixture of objects in the mass range 0.7−0.8 M⊙. Panels A–D: M10, M12, M14 and M15 populations respectively.
Current usage metrics show cumulative count of Article Views (full-text article views including HTML views, PDF and ePub downloads, according to the available data) and Abstracts Views on Vision4Press platform.
Data correspond to usage on the plateform after 2015. The current usage metrics is available 48-96 hours after online publication and is updated daily on week days.
Initial download of the metrics may take a while.