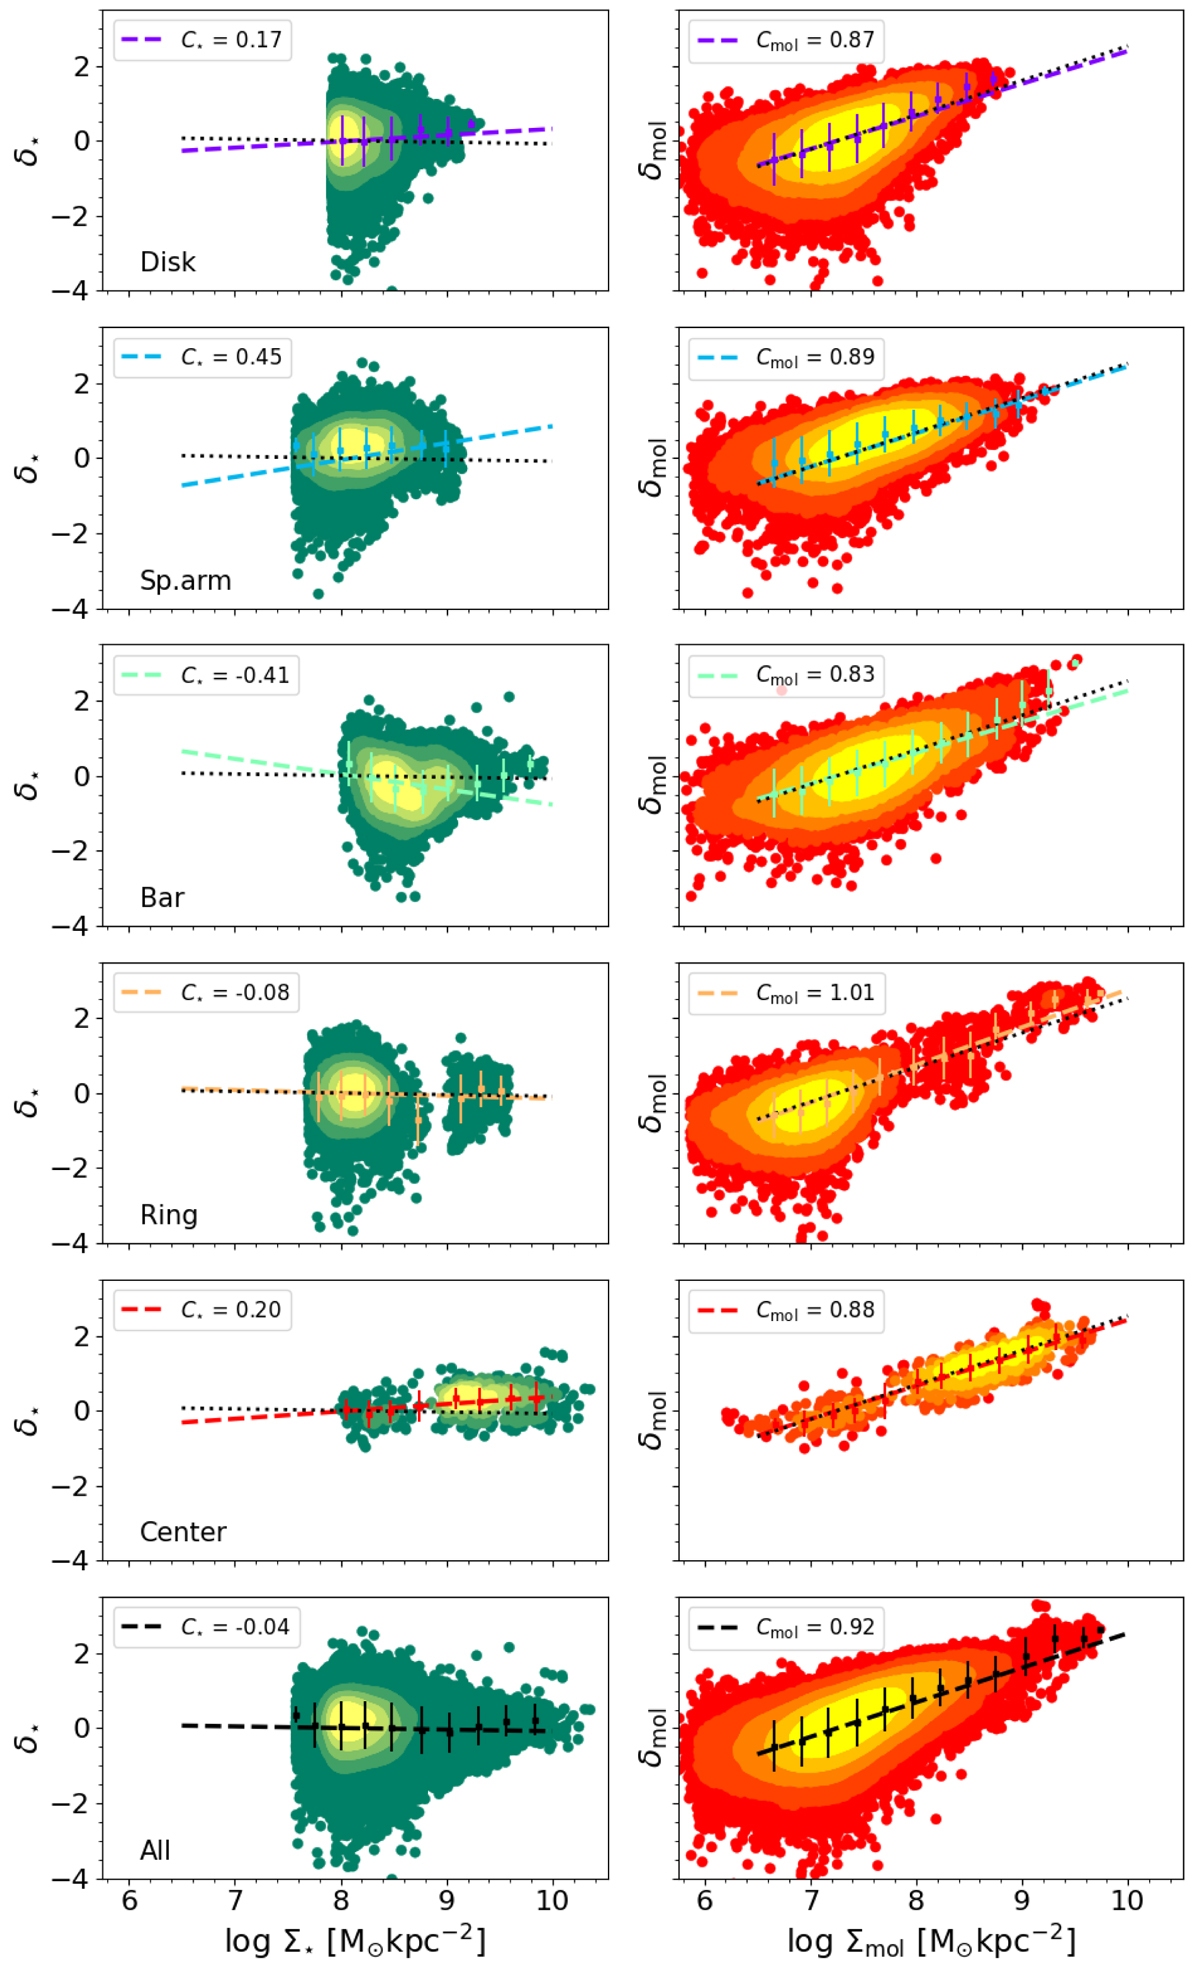
Fig. 4.
Download original image
Partial residual for each independent variable, dropping the dependency from the second independent variable, found for each individual environment and for all environments together as a function of Σ⋆ (left) and Σmol (right), measured at an spatial resolution of 150 pc. The binned data are shown for each corresponding environment. The trend for the full sample is overplotted as a black dotted line.
Current usage metrics show cumulative count of Article Views (full-text article views including HTML views, PDF and ePub downloads, according to the available data) and Abstracts Views on Vision4Press platform.
Data correspond to usage on the plateform after 2015. The current usage metrics is available 48-96 hours after online publication and is updated daily on week days.
Initial download of the metrics may take a while.