Open Access
Fig. 3.
Download original image
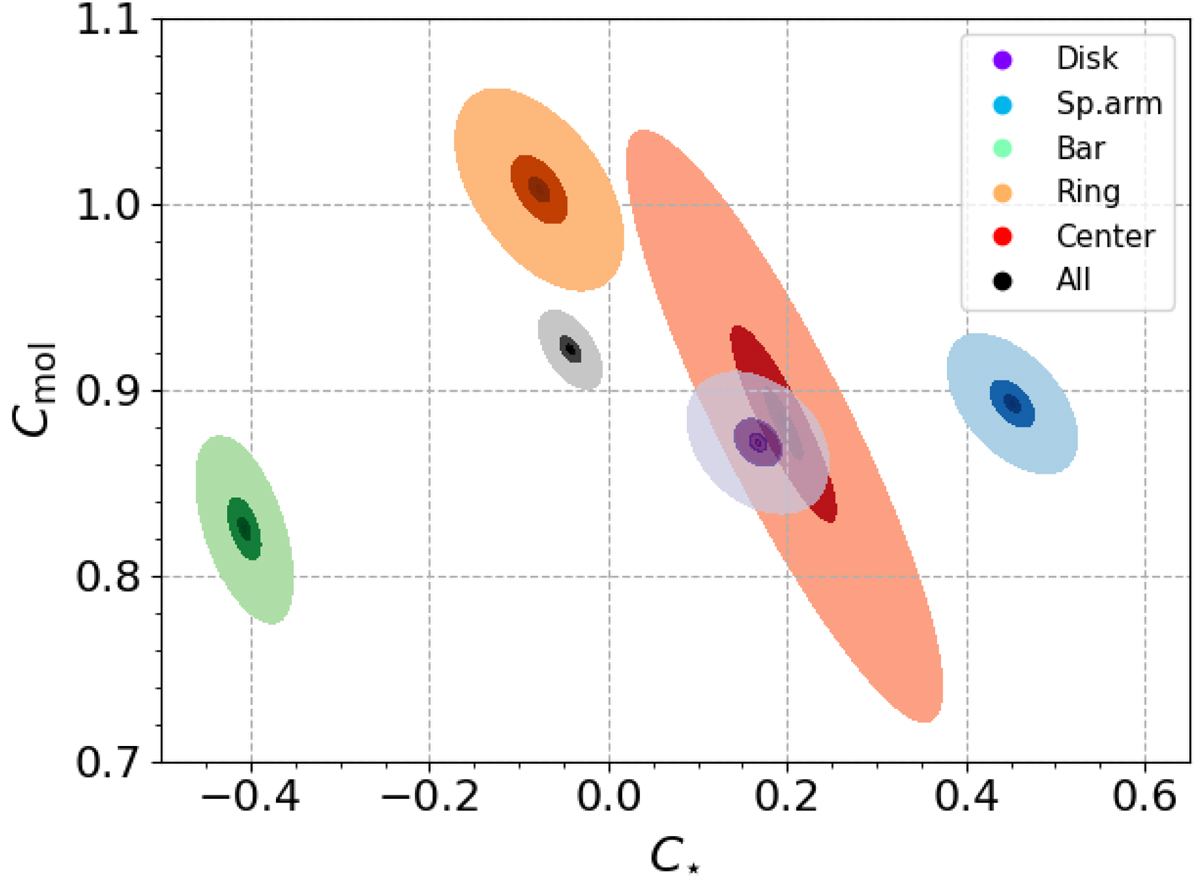
Posteriors distributions of the coefficients C⋆ and Cmol for each separate environment, measured at an spatial resolution of 150 pc, to show the covariance between them. The posteriors have been smoothed using a Gaussian kernel. The color scale for each environment indicates the 1-, 2- and 3-sigma confidence intervals.
Current usage metrics show cumulative count of Article Views (full-text article views including HTML views, PDF and ePub downloads, according to the available data) and Abstracts Views on Vision4Press platform.
Data correspond to usage on the plateform after 2015. The current usage metrics is available 48-96 hours after online publication and is updated daily on week days.
Initial download of the metrics may take a while.