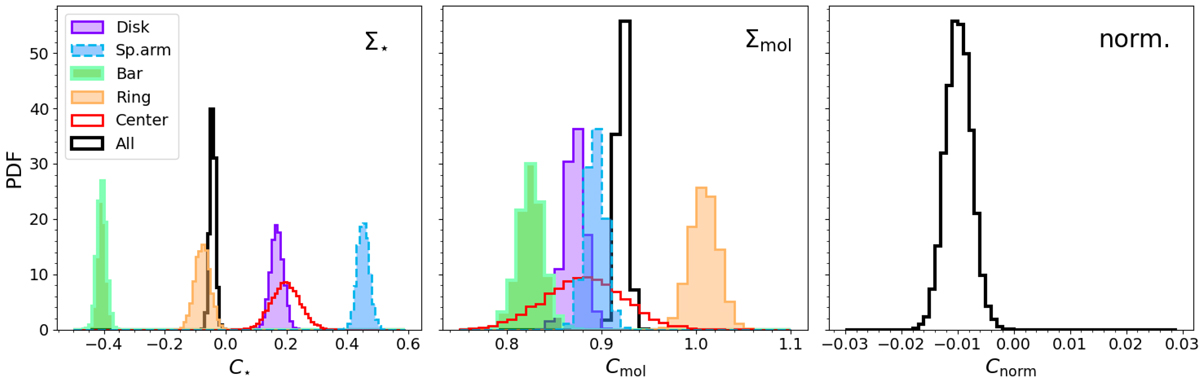
Fig. 2.
Download original image
Posterior distributions for the coefficients C⋆, Cmol and Cnorm that define the star-forming plane in each galactic environment, measured at a spatial resolution of 150 pc. As the posterior distribution of Cnorm is considerably narrower than that of C⋆ and Cmol, the x-axis has been binned in smaller bins and the distribution renormalized for an easier visualization.
Current usage metrics show cumulative count of Article Views (full-text article views including HTML views, PDF and ePub downloads, according to the available data) and Abstracts Views on Vision4Press platform.
Data correspond to usage on the plateform after 2015. The current usage metrics is available 48-96 hours after online publication and is updated daily on week days.
Initial download of the metrics may take a while.