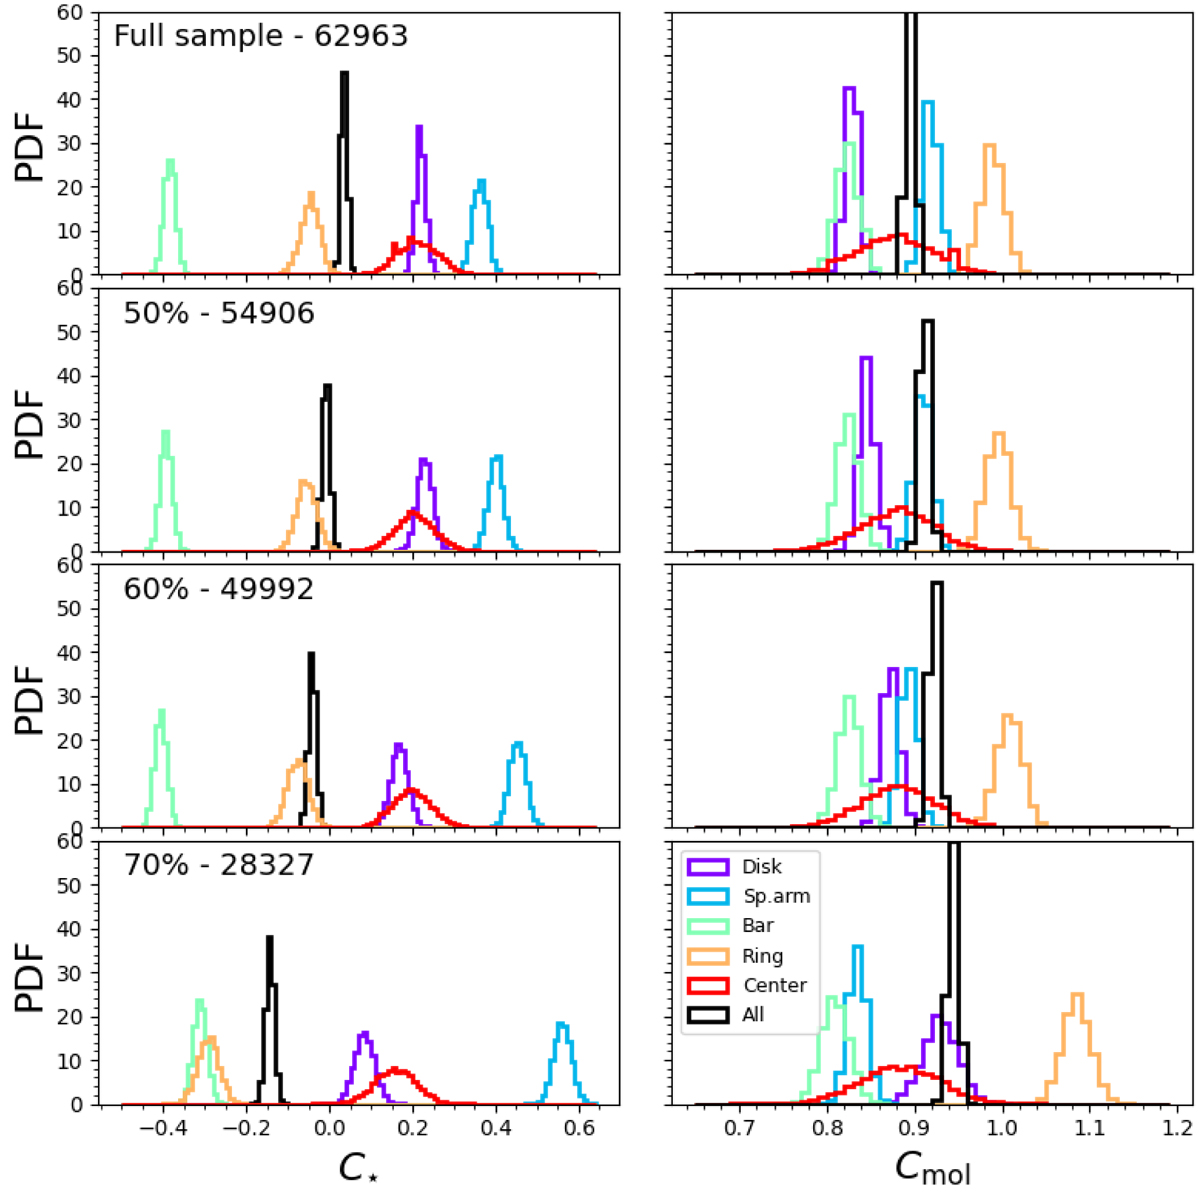
Fig. B.1.
Download original image
Posterior distributions obtained for the coefficients C⋆ and Cmol, following the same methodology described in Sect. 3.1, but applying different levels of detection fraction threshold. The top two panels show the base case scenario, using the full sample without applying any detection fraction threshold. The following panels show our fiducial adopted value (60%) and thresholds at 50% and 70%. The threshold level and the number of pixels used for each measurement are indicated in the top left corner for each row.
Current usage metrics show cumulative count of Article Views (full-text article views including HTML views, PDF and ePub downloads, according to the available data) and Abstracts Views on Vision4Press platform.
Data correspond to usage on the plateform after 2015. The current usage metrics is available 48-96 hours after online publication and is updated daily on week days.
Initial download of the metrics may take a while.