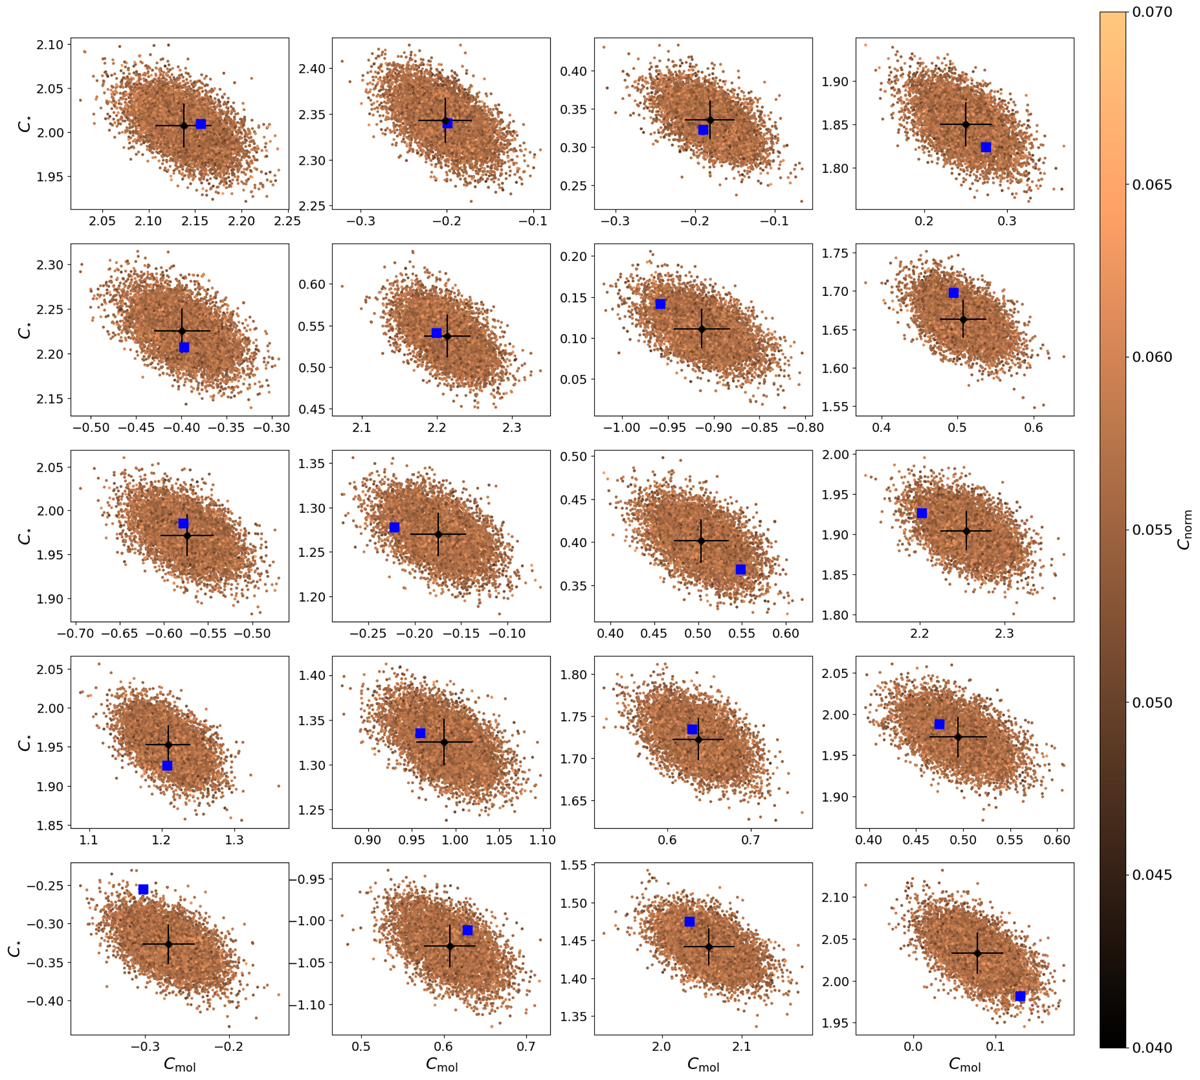
Fig. A.1.
Download original image
Results of the toy model fitting to test accuracy of the hierarchical fitting as well as origin of the C⋆ − Cmol covariance. Each panel shows the posterior distribution obtained for a simulated data set. The black diamond and its error bar marks the median and 1-sigma of the posterior distribution. The blue square marks the real pair of C⋆ − Cmol used to generate each simulated data set. The color code scales with the posterior value of Cnorm.
Current usage metrics show cumulative count of Article Views (full-text article views including HTML views, PDF and ePub downloads, according to the available data) and Abstracts Views on Vision4Press platform.
Data correspond to usage on the plateform after 2015. The current usage metrics is available 48-96 hours after online publication and is updated daily on week days.
Initial download of the metrics may take a while.