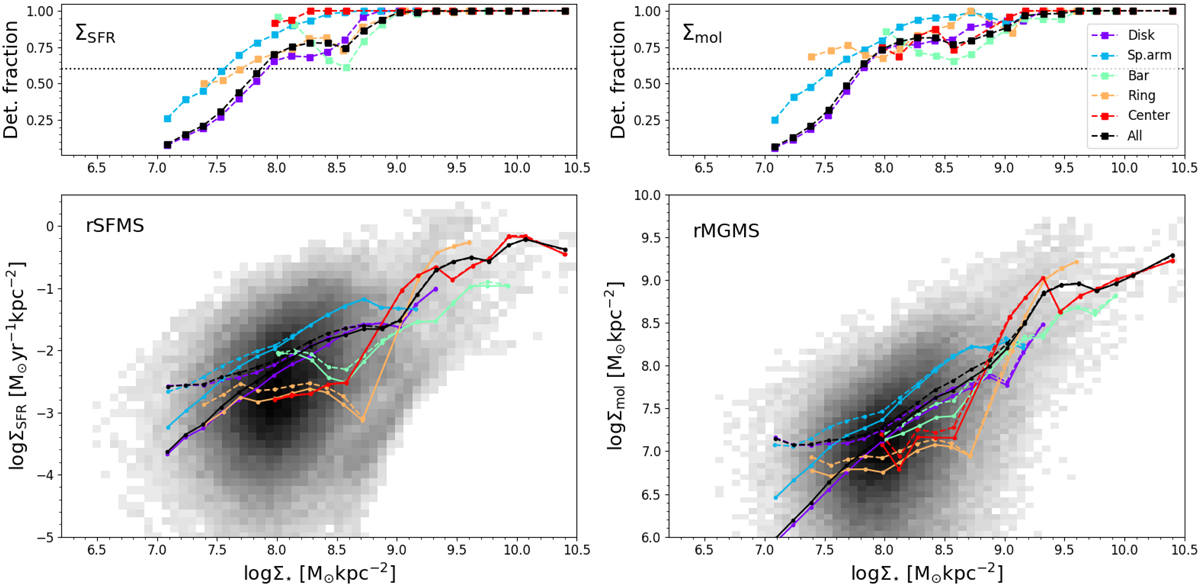
Fig. 1.
Download original image
rSFMS (bottom left) and rMGMS (bottom right) measured at 150 pc resolution for all galaxies in our sample. For reference and to guide the eye, the various solid colored lines represent the binned trends (bins of 0.15 dex) obtained for each environment, accounting for nondetections as detailed in Pessa et al. (2021). The black solid line shows the same measurement for all environments simultaneously. The dashed lines show the binned trends obtained when nondetections are neglected from the analysis. The panels on the top row show the detection fraction of ΣSFR (left) and Σmol (right), defined as the fraction of pixels with a measurement above our detection threshold in each bin of Σ⋆. The horizontal dotted line marks the detection fraction level of 60%.
Current usage metrics show cumulative count of Article Views (full-text article views including HTML views, PDF and ePub downloads, according to the available data) and Abstracts Views on Vision4Press platform.
Data correspond to usage on the plateform after 2015. The current usage metrics is available 48-96 hours after online publication and is updated daily on week days.
Initial download of the metrics may take a while.