Fig. A.2
Download original image
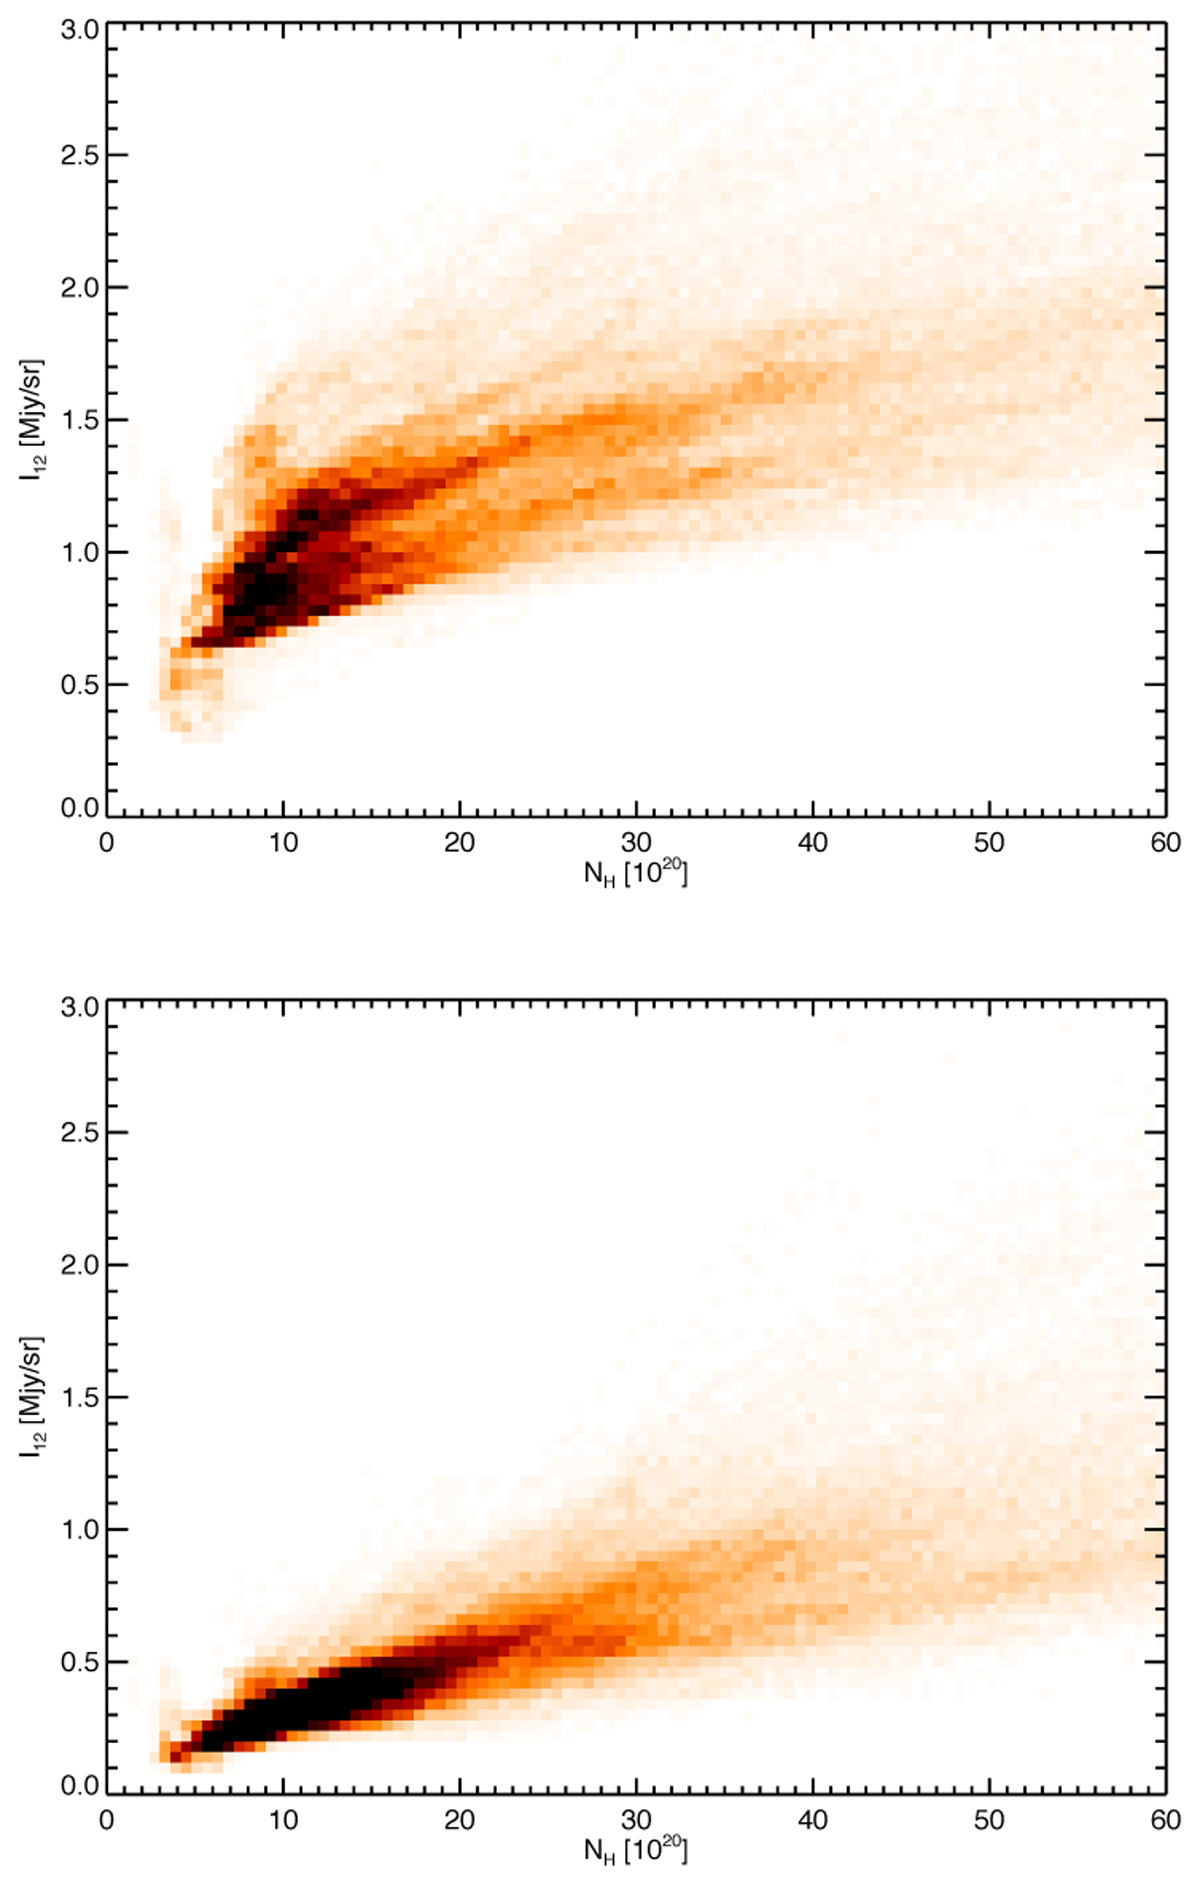
Two-dimensional histogram of the 12 μm emission as a function of NH deduced from the τ353 GHz dust optical depth map of Planck Collaboration XI (2014) before (top) and after (bottom) zodiacal correction. The data are from the maps used in the current paper; all maps are at 1° resolution, and only the pixels in the mask shown in Fig. 1 were used to build the histograms.
Current usage metrics show cumulative count of Article Views (full-text article views including HTML views, PDF and ePub downloads, according to the available data) and Abstracts Views on Vision4Press platform.
Data correspond to usage on the plateform after 2015. The current usage metrics is available 48-96 hours after online publication and is updated daily on week days.
Initial download of the metrics may take a while.