Fig. 7
Download original image
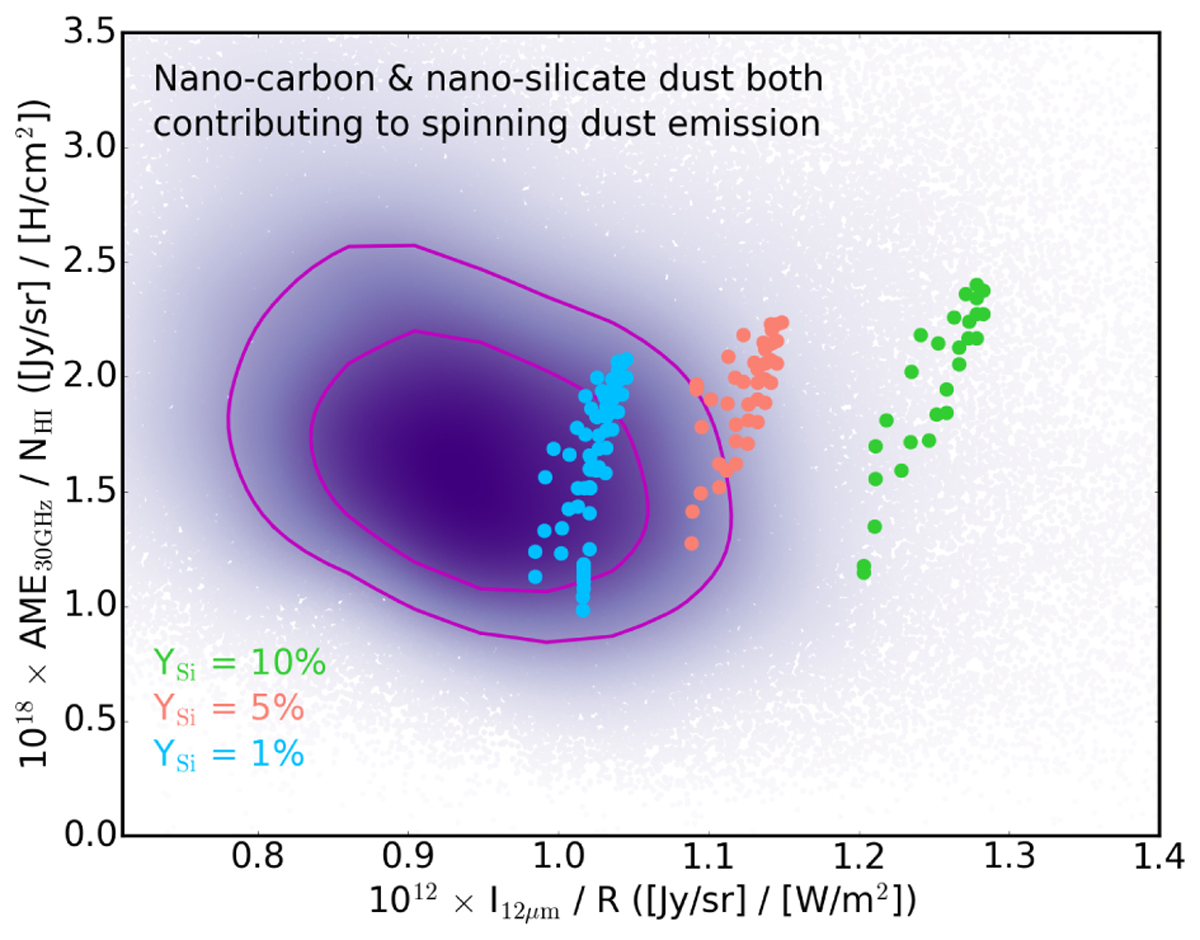
AME30 GHz/NHI vs. I12 μm/R as in Fig. 6. The green dots show best fitting models in which both the nano-carbon dust and the nano-silicate dust produce spinning emission (case 2, YSi = 10%, m = 0.3 D, σ = 0.1), with each point showing a different fCNM value. Model calculations for lower abundances of nano-silicates are shown: YSi = 5% (pink dots) and YSi = 1% (blue dots).
Current usage metrics show cumulative count of Article Views (full-text article views including HTML views, PDF and ePub downloads, according to the available data) and Abstracts Views on Vision4Press platform.
Data correspond to usage on the plateform after 2015. The current usage metrics is available 48-96 hours after online publication and is updated daily on week days.
Initial download of the metrics may take a while.