Fig. 6
Download original image
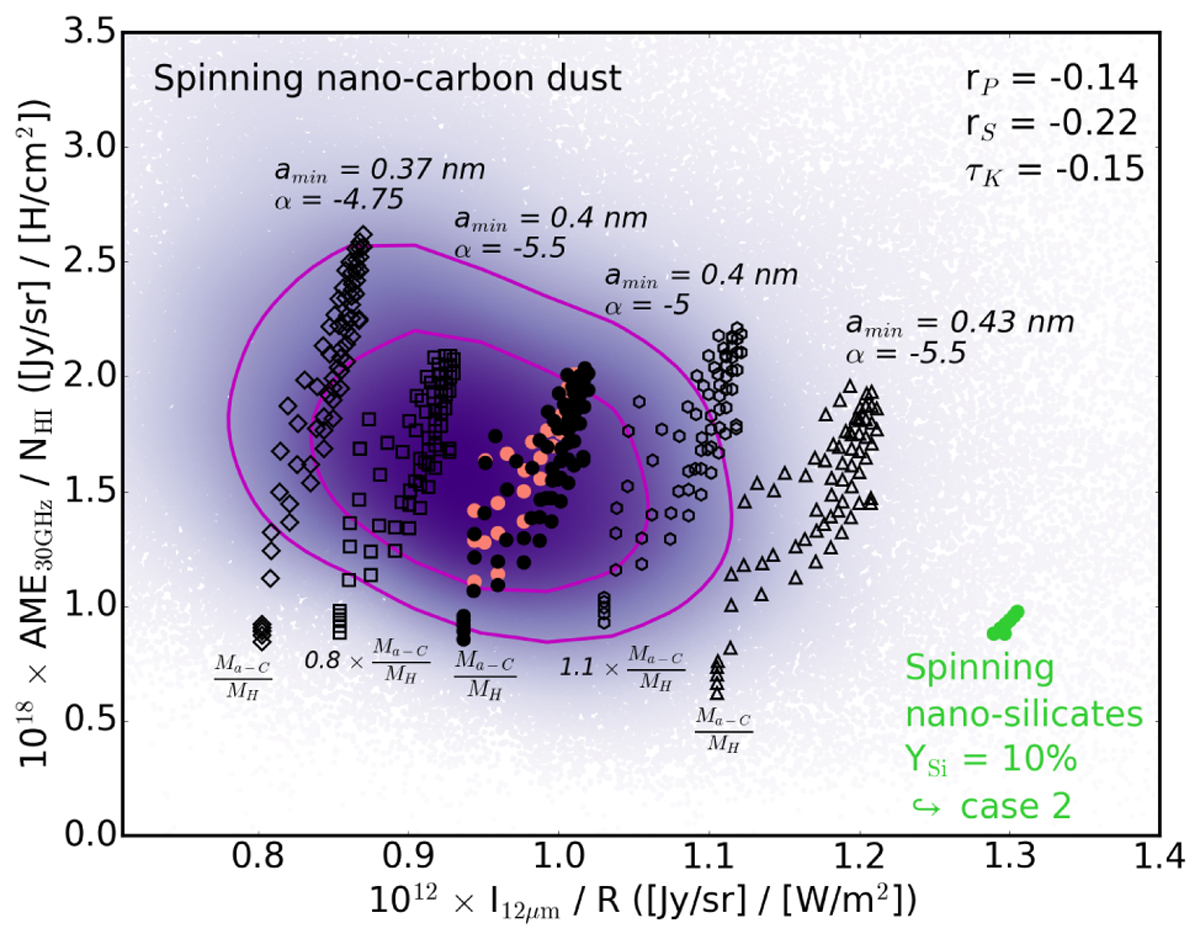
Density of the points map of AME30 GHz/NHI vs. I12 μm/R. We overplot the contours enclosing 50% of the pixels (internal contour) and 75% of the pixels (external contour). The rP, rS, and τK give the corresponding Pearson correlation coefficient, the Spearman rank-order correlation coefficient, and the Kendall’s tau, respectively. The same models as in Fig. 5 are shown with black and pink circles for spinning nano-carbon dust, m = 0.38 and 0.5 D, respectively, and green circles for spinning nano-silicate dust (case 2), each symbol showing a different value of fCNM (see Sects. 5.2 and 5.3 for details). For spinning nano-carbon dust, we show models with the same fCNM but with variations in the size distribution and dust abundance. The standard THEMIS size distribution with amin = 0.4 nm and α = –5, where α is the a-C nano-particle power-law exponent, is shown for m = 0.38 D (black circles). We show this same model, but with an abundance increase of 10% (hexagons). The squares show amin = 0.4 nm, α = –5.5, and an abundance decrease by 20%. The triangles show amin = 0.43 nm and α = –5.5, and the diamonds show αmin = 0.37 nm and α = –4.75 with the standard model abundances.
Current usage metrics show cumulative count of Article Views (full-text article views including HTML views, PDF and ePub downloads, according to the available data) and Abstracts Views on Vision4Press platform.
Data correspond to usage on the plateform after 2015. The current usage metrics is available 48-96 hours after online publication and is updated daily on week days.
Initial download of the metrics may take a while.