Fig. 4
Download original image
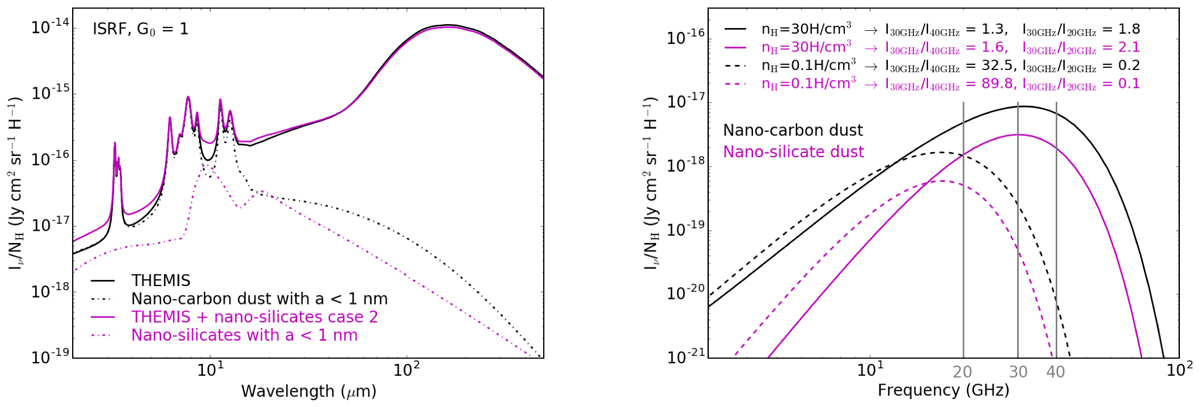
Comparison of mid-IR to microwave SEDs. Left: SED of thermal dust emission for dust models without (black lines) and with (magenta lines) nano-silicate dust for G0 = 1. In both cases, the dash-dotted lines show the contribution of the smallest nano-grains with a < 1 nm that cause the spinning-dust emission. The nano-silicates are those of case 2, which are the closest in size distribution and electric dipole moment to the THEMIS nano-carbon dust. Right: corresponding spinning-dust emission for media with nH = 0.1 and 30 H cm–3 as solid and dashed lines, respectively.
Current usage metrics show cumulative count of Article Views (full-text article views including HTML views, PDF and ePub downloads, according to the available data) and Abstracts Views on Vision4Press platform.
Data correspond to usage on the plateform after 2015. The current usage metrics is available 48-96 hours after online publication and is updated daily on week days.
Initial download of the metrics may take a while.