Fig. 3
Download original image
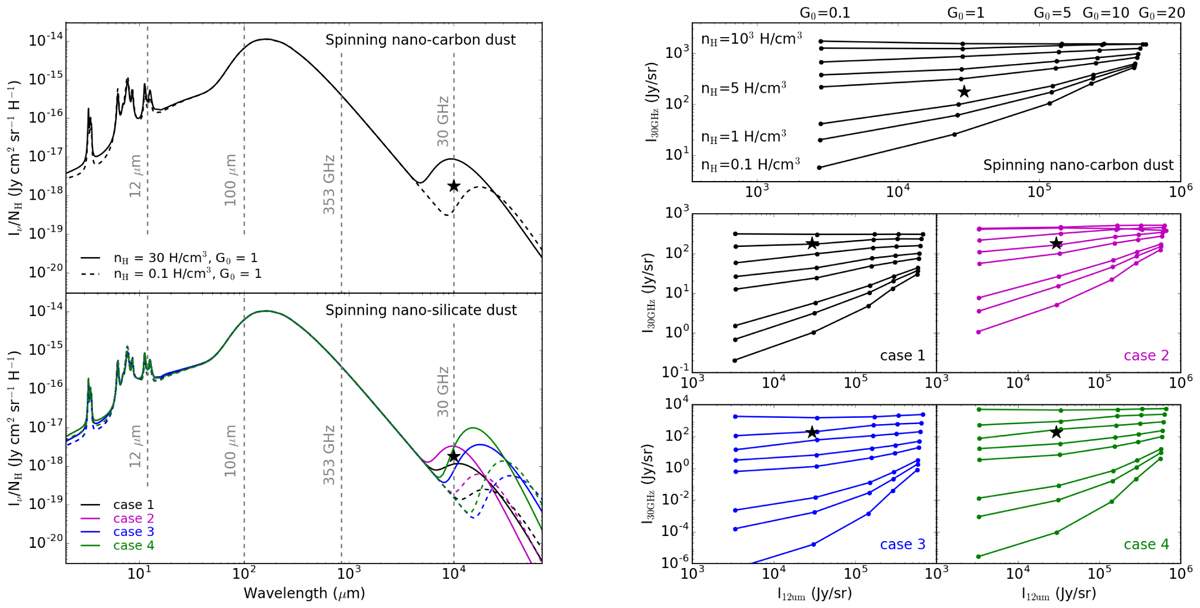
Thermal and spinning dust modelling results. Left: dust SEDs for media illuminated by the ISRF with G0 = 1. The dashed and solid lines show media with gas local densities of 30 H cm–3 and 0.1 H cm–3, respectively. The black star shows the average AME emissivity at 30 GHz for the bulk of pixels included in the 50% contour in Fig. 5, to avoid pixels with the highest and lowest densities and radiation fields. The upper panel shows spinning nano-carbon grains, and the bottom panel presents spinning nano-silicates with case 1 in black, case 2 in magenta, case 3 in blue, and case 4 in green; see Sect. 3.1 for details. Right: spinning nano-dust emission at 30 GHz vs. thermal nano-dust emission at 12 μm for NHI = 1020 H cm–2. Each panel shows the results obtained for media with densities nH = 0.1, 0.5, 1, 5, 10, 30, 100, and 1000 H cm–3 from bottom to top. The radiation fields scaled by G0 = 0.1, 1, 5, 10, and 20 are shown from left to right. The upper panel displays spinning nano-carbons. The lower panels show the four cases of spinning nano-silicates described in Sect. 3.1: case 1 in black, case 2 in magenta, case 3 in blue, and case 4 in green. The black star shows the average AME emissivity at 30 GHz vs. the average emissivity at 12 μm, both scaled to NH = 1020 H cm–2.
Current usage metrics show cumulative count of Article Views (full-text article views including HTML views, PDF and ePub downloads, according to the available data) and Abstracts Views on Vision4Press platform.
Data correspond to usage on the plateform after 2015. The current usage metrics is available 48-96 hours after online publication and is updated daily on week days.
Initial download of the metrics may take a while.