Fig. 6.
Download original image
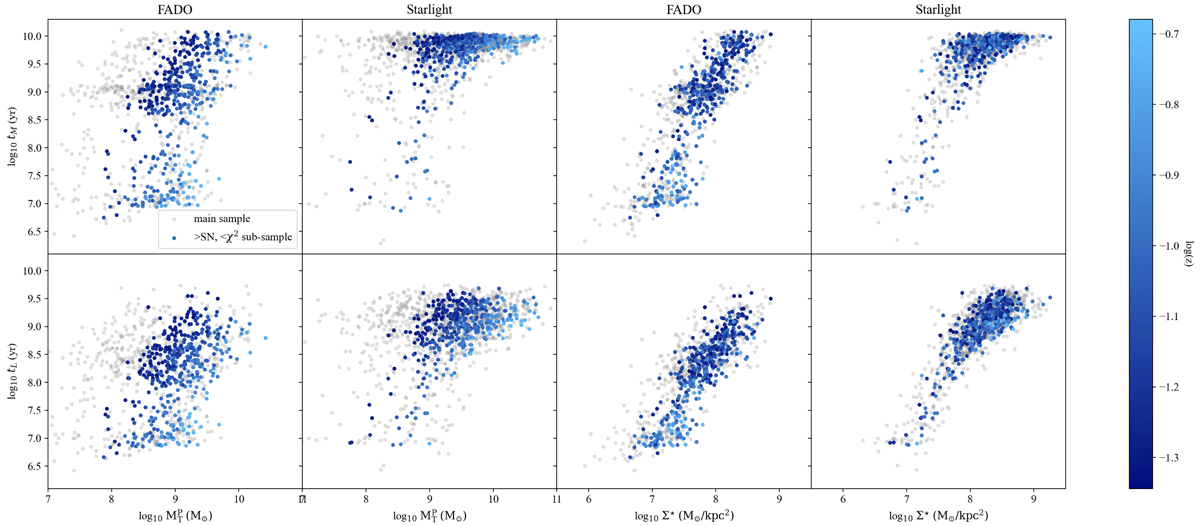
Correlations between the mean stellar age (mass-weighted in the top row and luminosity-weighted in the bottom row) and the corrected total stellar mass (first four panels) and corrected surface stellar density (last four panels), as obtained by FADO (first and third columns) and STARLIGHT (second and forth columns). Coloured circles depict the high-S/N EELG sample whereas grey circles depict the main EELG sample. The colours correspond to the redshift distribution of the sample, as given by the colour-bar displayed in the right-hand-side of the plot.
Current usage metrics show cumulative count of Article Views (full-text article views including HTML views, PDF and ePub downloads, according to the available data) and Abstracts Views on Vision4Press platform.
Data correspond to usage on the plateform after 2015. The current usage metrics is available 48-96 hours after online publication and is updated daily on week days.
Initial download of the metrics may take a while.