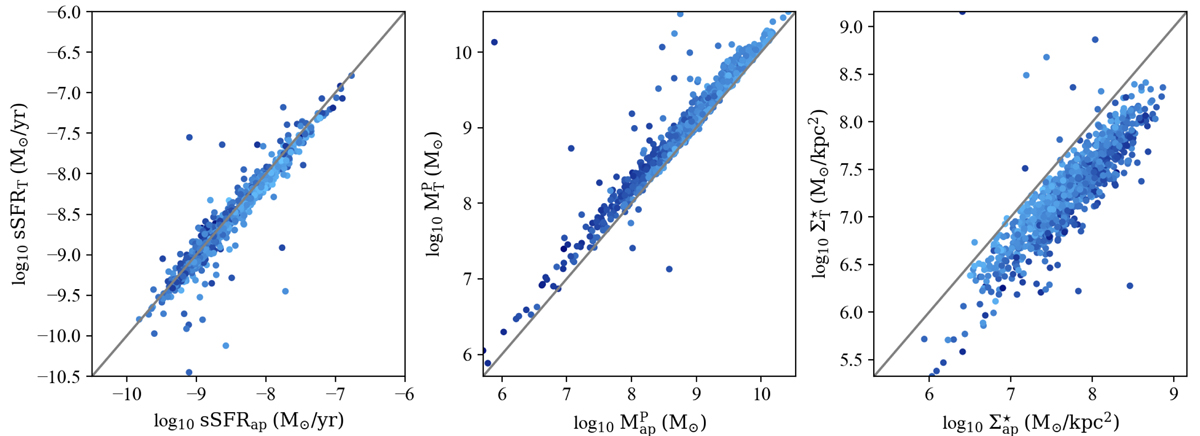
Fig. 4.
Download original image
Differences between aperture-corrected (x axis) and non-corrected quantities (y axis), such as sSFR (left-hand-side panel), present-day stellar mass as obtained by FADO (central panel) and stellar surface density (right-hand-side panel), for the EELG sample. Identity lines are represented in grey. As in Fig. 3, data points are coloured as specified by their redshift distribution.
Current usage metrics show cumulative count of Article Views (full-text article views including HTML views, PDF and ePub downloads, according to the available data) and Abstracts Views on Vision4Press platform.
Data correspond to usage on the plateform after 2015. The current usage metrics is available 48-96 hours after online publication and is updated daily on week days.
Initial download of the metrics may take a while.