Fig. 8
Download original image
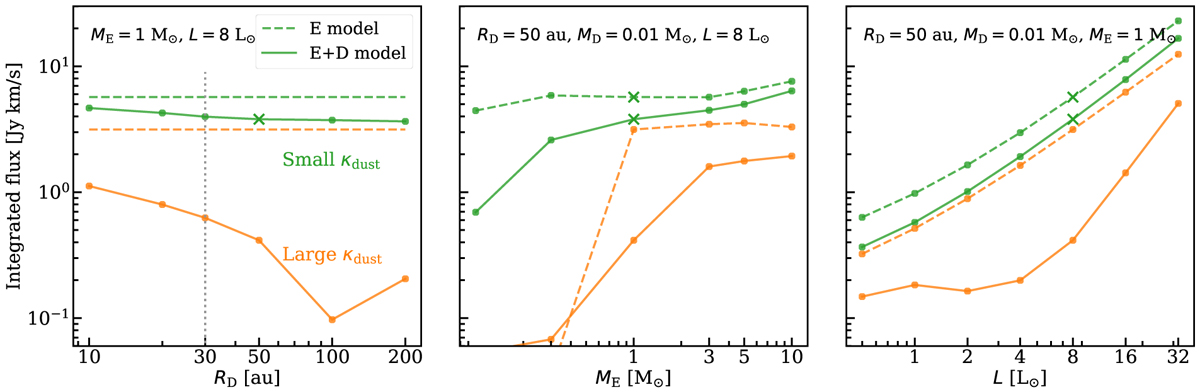
Integrated fluxes of the methanol lines for models with low (green) and high (orange) mm opacity dust grains. The dashed lines show the envelope-only models, and the solid lines show the envelope-plus-disk models. The fiducial models are indicated by a cross. The models are the same as those plotted in Fig. 5. The dotted line indicates the minimum disk radius needed to see a drop of a factor of about two in intensity of the envelope-plus-disk model.
Current usage metrics show cumulative count of Article Views (full-text article views including HTML views, PDF and ePub downloads, according to the available data) and Abstracts Views on Vision4Press platform.
Data correspond to usage on the plateform after 2015. The current usage metrics is available 48-96 hours after online publication and is updated daily on week days.
Initial download of the metrics may take a while.