Fig. 7
Download original image
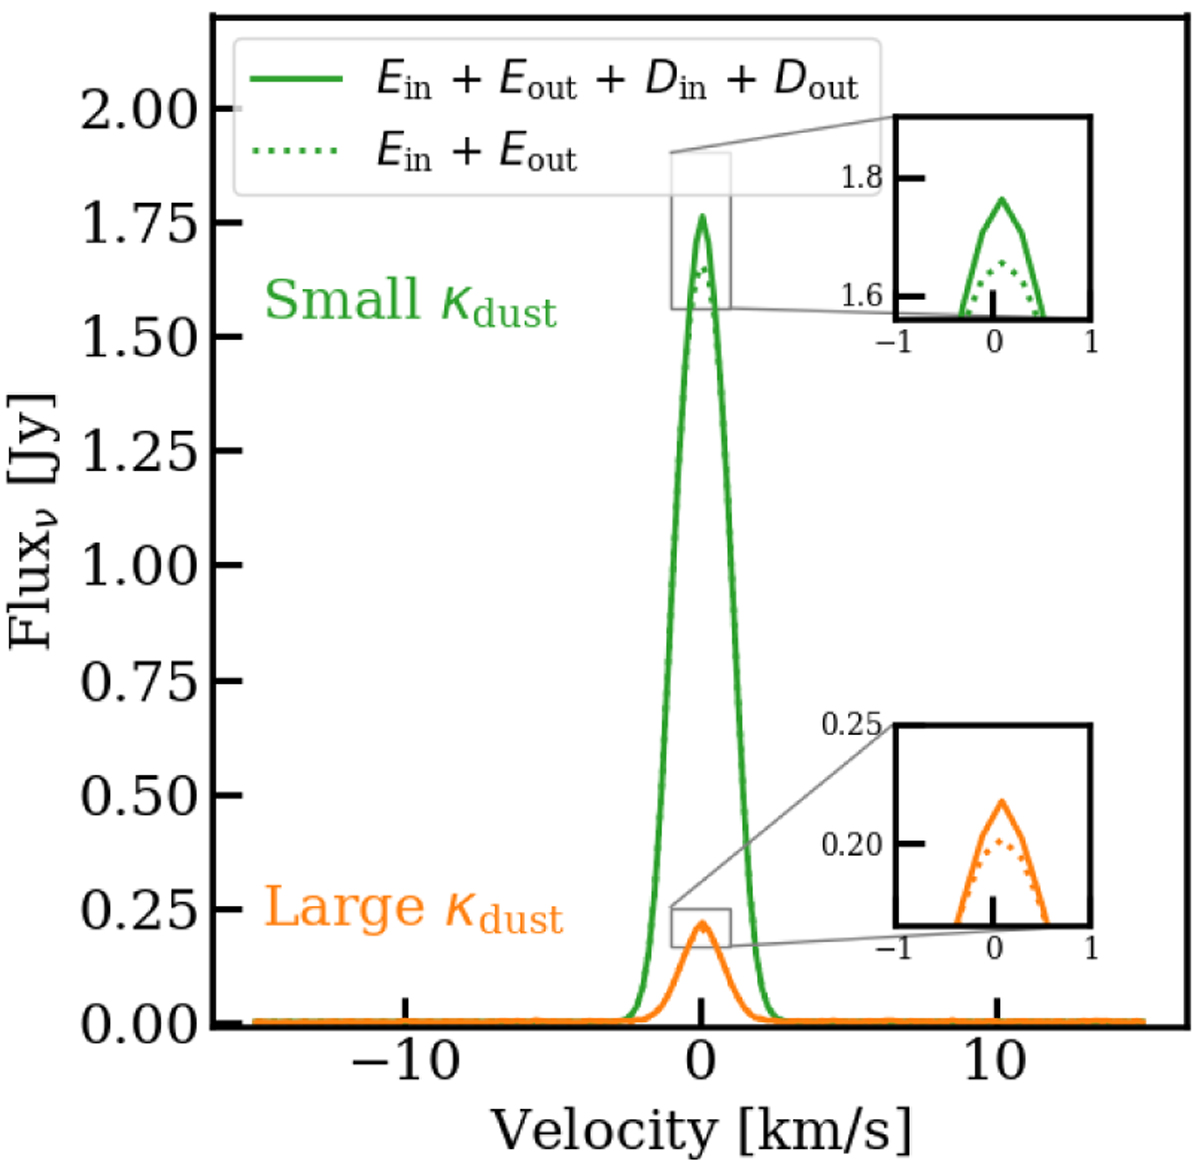
Comparison of the spectral line emission of methanol from the envelope component of the envelope-plus-disk model (dotted lines) and emission from the envelope component and the disk component of the envelope-plus-disk model (solid lines). The line fluxes for the envelope component of the envelope-plus-disk model (dotted lines) were calculated by setting the abundance of methanol in the disk to zero. Green shows the fiducial model, i.e. low mm opacity dust grains, and orange shows the fiducial model with high mm opacity dust grains.
Current usage metrics show cumulative count of Article Views (full-text article views including HTML views, PDF and ePub downloads, according to the available data) and Abstracts Views on Vision4Press platform.
Data correspond to usage on the plateform after 2015. The current usage metrics is available 48-96 hours after online publication and is updated daily on week days.
Initial download of the metrics may take a while.