Fig. 6
Download original image
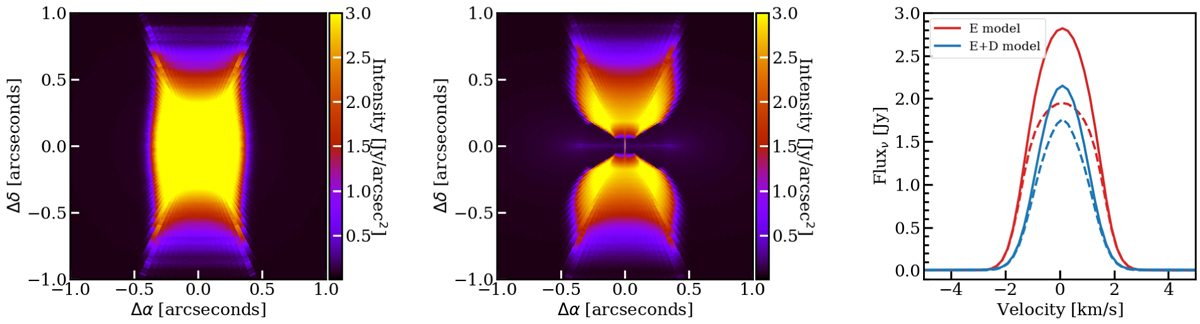
Methanol emission for the fiducial models (low mm opacity dust). The left panel shows the emission from methanol at the peak of the line (0 km s–1) for the envelope-only model viewed edge-on, and the middle panel shows the same for the envelope-plus-disk model. Because no free-fall velocity is assumed, the line profile is nearly Gaussian with no infall signatures and thus, the emission at the peak of the line is similar to the integrated intensity map of the line. The right panel is the comparison between the line emission from the envelope-only model and the envelope-plus-disk model seen face-on (dashed lines) and edge-on (solid lines) after integrating over a 2″ diameter emitting area (300 au at the assumed source distance of 150 pc).
Current usage metrics show cumulative count of Article Views (full-text article views including HTML views, PDF and ePub downloads, according to the available data) and Abstracts Views on Vision4Press platform.
Data correspond to usage on the plateform after 2015. The current usage metrics is available 48-96 hours after online publication and is updated daily on week days.
Initial download of the metrics may take a while.