Fig. 4
Download original image
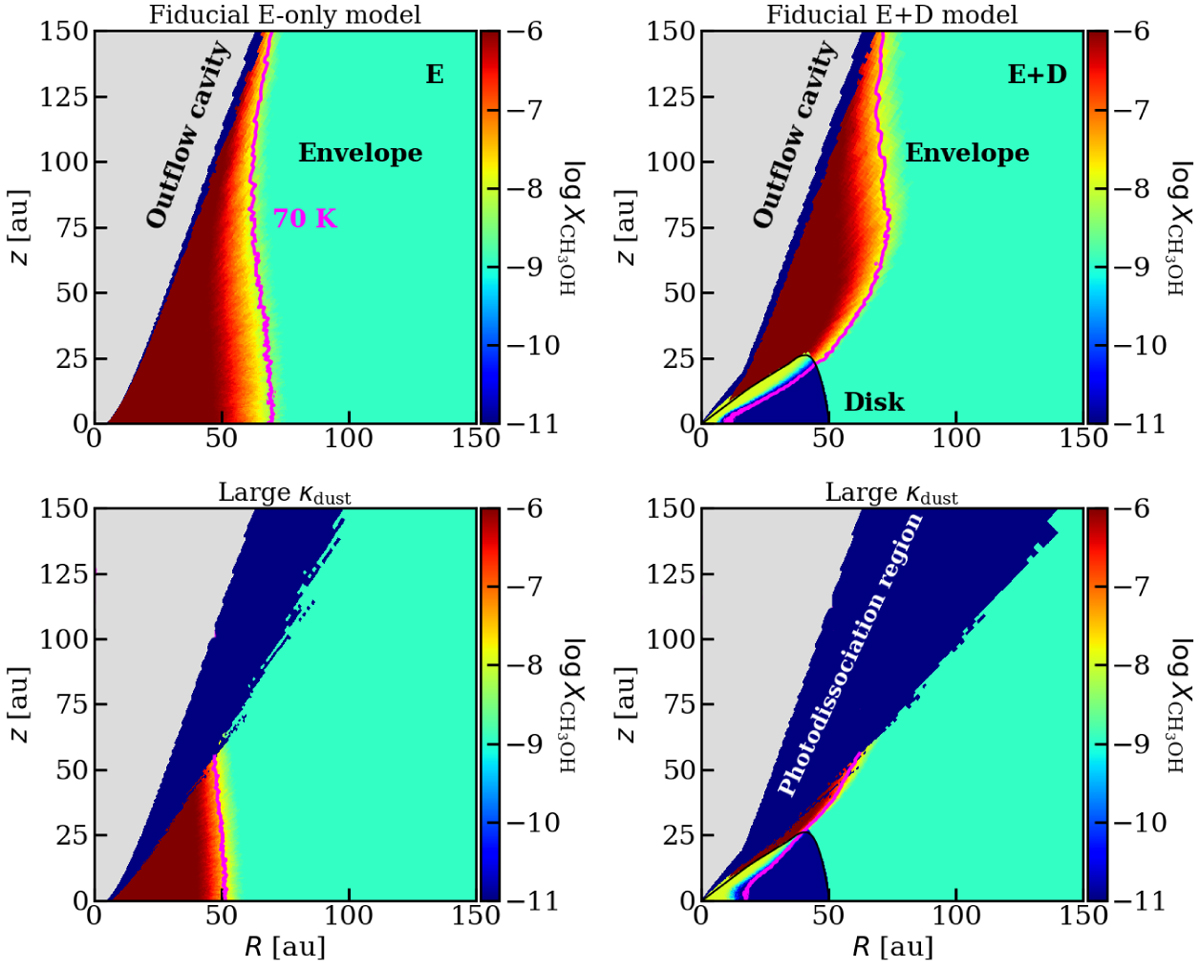
Methanol abundance maps for the envelope-only (left) and envelope-plus-disk (right) models. The magenta contours show where the temperature is 70 K to indicate where the approximate sublimation surfaces of methanol are at the densities in the models. The photodissociation region (τUV < 3) is much larger in the envelope for the dust distribution with high mm opacity.
Current usage metrics show cumulative count of Article Views (full-text article views including HTML views, PDF and ePub downloads, according to the available data) and Abstracts Views on Vision4Press platform.
Data correspond to usage on the plateform after 2015. The current usage metrics is available 48-96 hours after online publication and is updated daily on week days.
Initial download of the metrics may take a while.