Fig. 12
Download original image
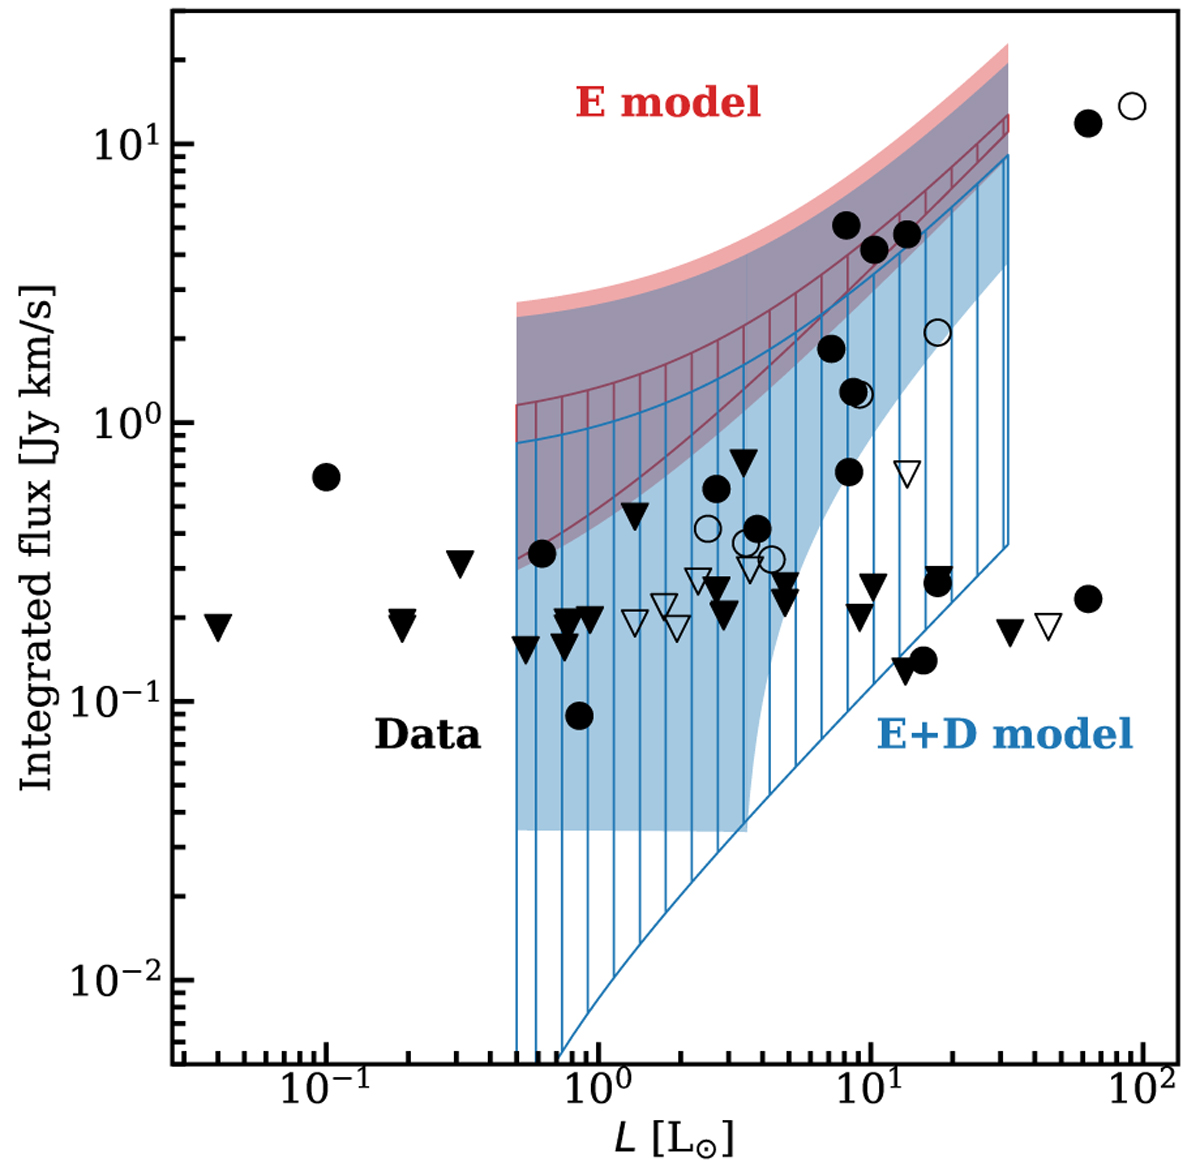
Comparison of the integrated intensities found from the models with observations (black circles) normalised to a source distance of 150 pc. Red represents the regions with envelope-only models, and blue shows the regions with envelope-plus-disk models. The smooth regions indicate the models with low mm opacity dust grains, and striped regions show the models with high mm opacity dust grains. The envelope-only models with high mm opacity dust grains and envelope masses of 0.1 M⊙ and 0.3 M⊙ are not included here as most of the envelope is photodissociated (Sect. 3.2). Triangles show the upper limits found from observations, and the hollow points are sources with a disk. To explain most of the data, both a disk and optically thick dust are needed.
Current usage metrics show cumulative count of Article Views (full-text article views including HTML views, PDF and ePub downloads, according to the available data) and Abstracts Views on Vision4Press platform.
Data correspond to usage on the plateform after 2015. The current usage metrics is available 48-96 hours after online publication and is updated daily on week days.
Initial download of the metrics may take a while.