Fig. 10
Download original image
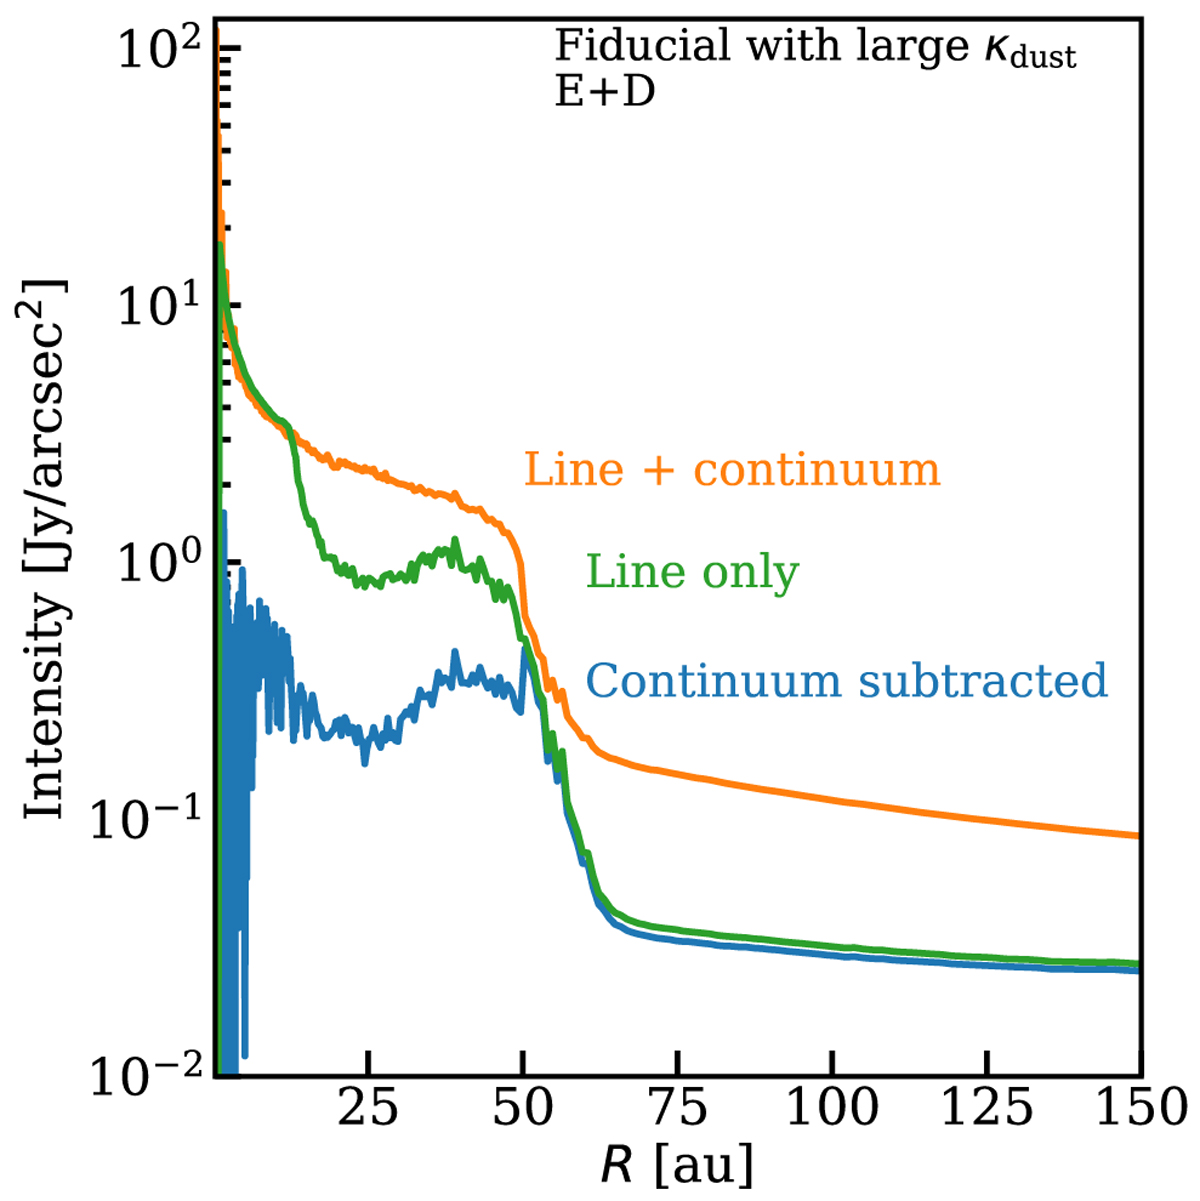
Effect of continuum over-subtraction in the fiducial envelope-plus-disk model with large κdust at mm. Orange shows a radial cut through the methanol emission image including dust continuum at the line peak (0 km s–1). Green shows the same without dust in the model (true line intensity). Blue shows the same as orange but continuum subtracted. There is a difference of a factor of about four to up to an order of magnitude between the continuum-subtracted intensity and the true line intensity due to the continuum over-subtraction effect.
Current usage metrics show cumulative count of Article Views (full-text article views including HTML views, PDF and ePub downloads, according to the available data) and Abstracts Views on Vision4Press platform.
Data correspond to usage on the plateform after 2015. The current usage metrics is available 48-96 hours after online publication and is updated daily on week days.
Initial download of the metrics may take a while.