Free Access
Fig. 13.
Download original image
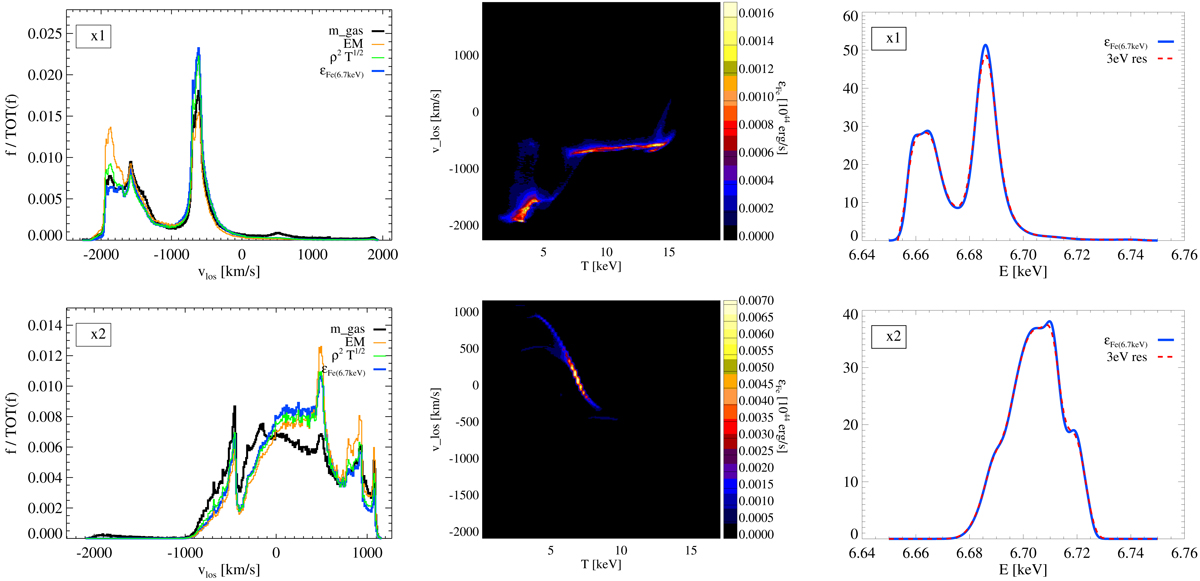
Same as Fig. 2, but for regions x1 and x2, where the l.o.s. is aligned with the merging axis. Top panels: (x1), one can notice the asymmetric double component distribution of ICM velocities, corresponding to the two cluster cores.
Current usage metrics show cumulative count of Article Views (full-text article views including HTML views, PDF and ePub downloads, according to the available data) and Abstracts Views on Vision4Press platform.
Data correspond to usage on the plateform after 2015. The current usage metrics is available 48-96 hours after online publication and is updated daily on week days.
Initial download of the metrics may take a while.