Fig. 12.
Download original image
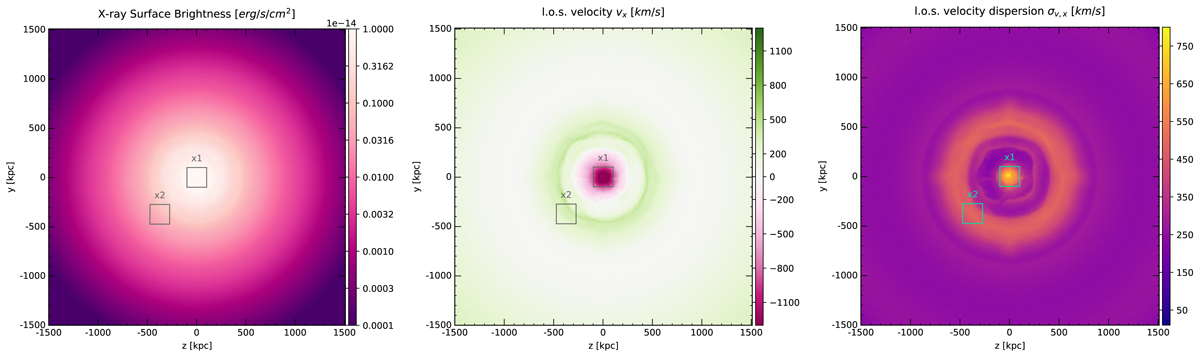
Projected maps of X-ray flux in the 0.5−7 keV band (left) and EM-weighted l.o.s. velocity (middle) and velocity dispersion (right), for the x-axis projection, that is with the l.o.s. aligned with the merger axis. The projection is performed over 10 Mpc. Overplotted, the two square XRISM-like pointings (x1 and x2) of 200 kpc per side.
Current usage metrics show cumulative count of Article Views (full-text article views including HTML views, PDF and ePub downloads, according to the available data) and Abstracts Views on Vision4Press platform.
Data correspond to usage on the plateform after 2015. The current usage metrics is available 48-96 hours after online publication and is updated daily on week days.
Initial download of the metrics may take a while.