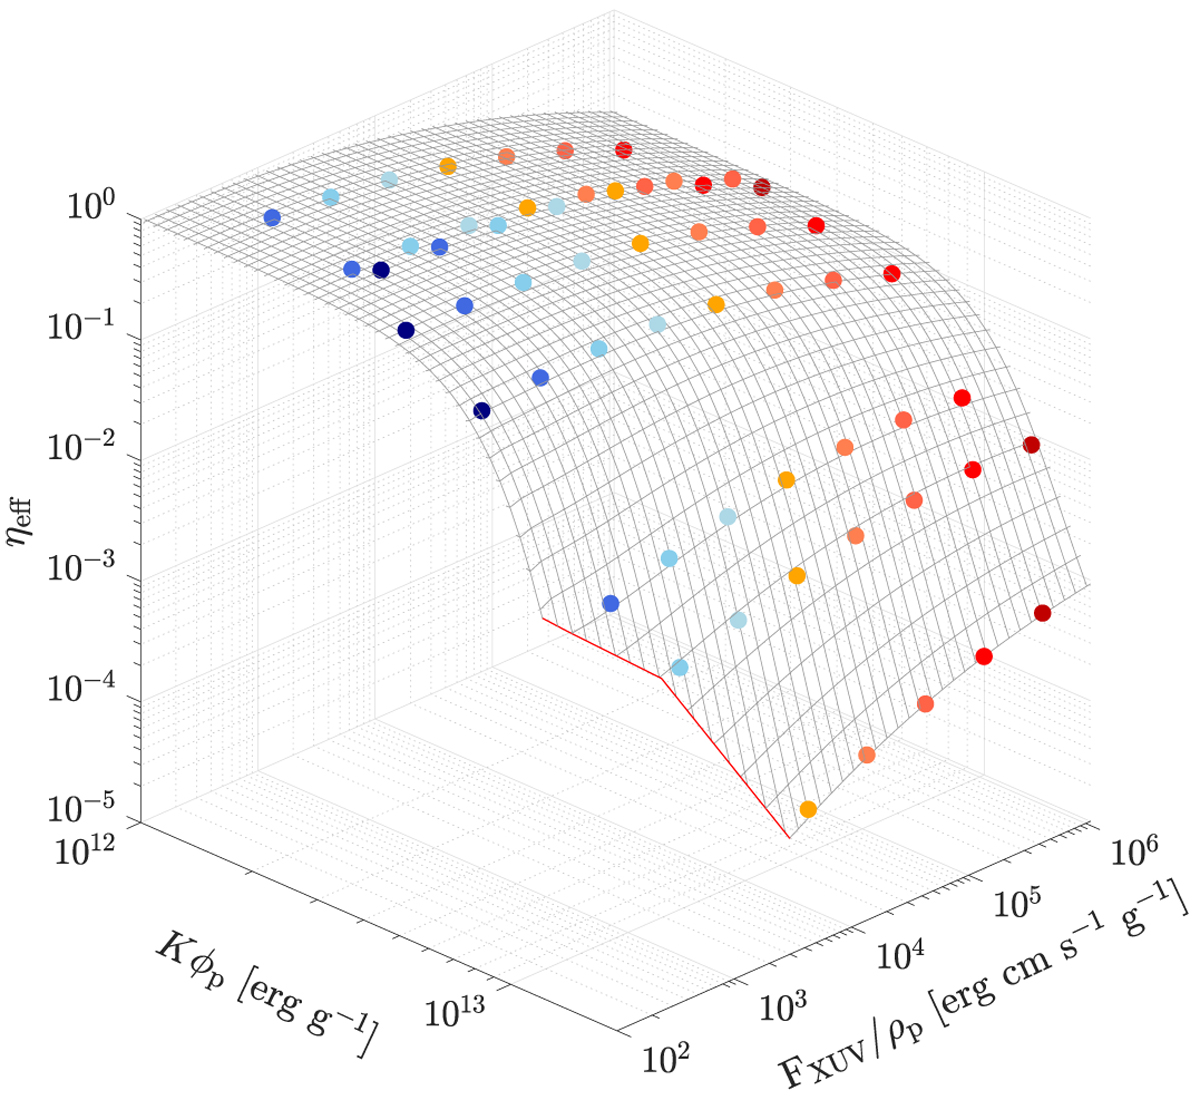
Fig. A.1
Download original image
Analytic approximation of the function ηeff(FXUV/ρp, Kϕp) as given by Eqs. (A.2)–(A.7). The data points are color-coded to reflect the intensity of the XUV irradiation, according to the same color scheme as in Fig. 2 where FXUV varies between 102 (deepest blue) and 106 (deepest red) erg s−1 cm−2. The thick red line represents the convergence limit of the ATES code described in Sect. 6.1 of Caldiroli et al. (2021).
Current usage metrics show cumulative count of Article Views (full-text article views including HTML views, PDF and ePub downloads, according to the available data) and Abstracts Views on Vision4Press platform.
Data correspond to usage on the plateform after 2015. The current usage metrics is available 48-96 hours after online publication and is updated daily on week days.
Initial download of the metrics may take a while.