Fig. 8
Download original image
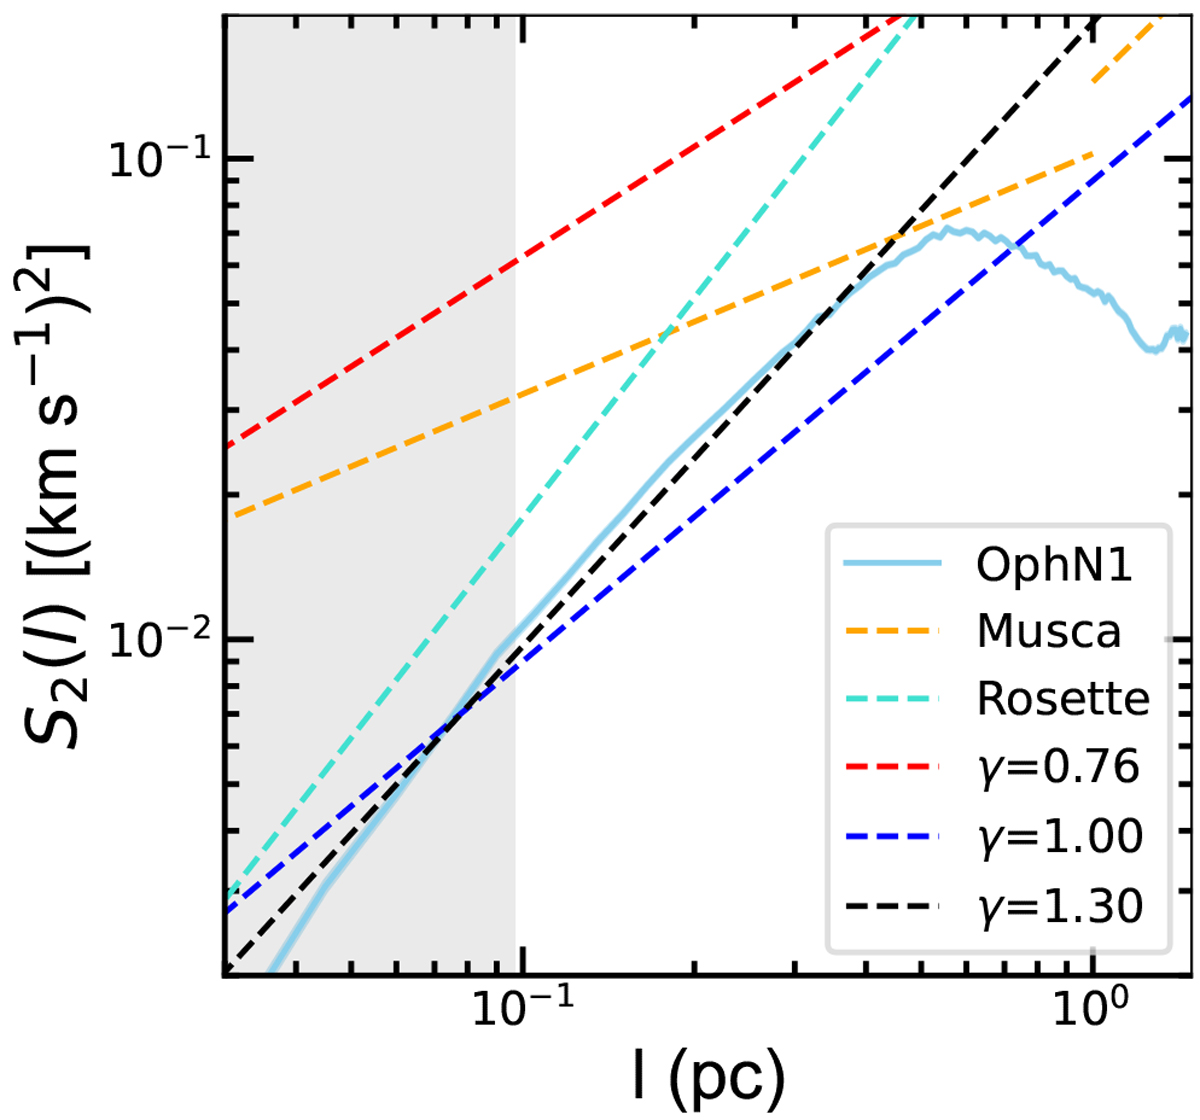
Second-order velocity structure function of Oph Nl derived from Fig. 5b as a function of the spatial lag, l. The gray-shaded region is the spatial-resolution limit which corresponds to 55″. The power-law fitting result is indicated by the black dashed line. The orange, red, and blue dashed lines represent the observed relation in Musca (Hacar et al. 2016) and Rossete (Heyer et al. 2006), the classic Larson relation (γ = 0.76; Larson 1981), and the revised relation, σ ∝ R0.5 (γ = l; Heyer et al. 2009), respectively.
Current usage metrics show cumulative count of Article Views (full-text article views including HTML views, PDF and ePub downloads, according to the available data) and Abstracts Views on Vision4Press platform.
Data correspond to usage on the plateform after 2015. The current usage metrics is available 48-96 hours after online publication and is updated daily on week days.
Initial download of the metrics may take a while.