Fig. 6
Download original image
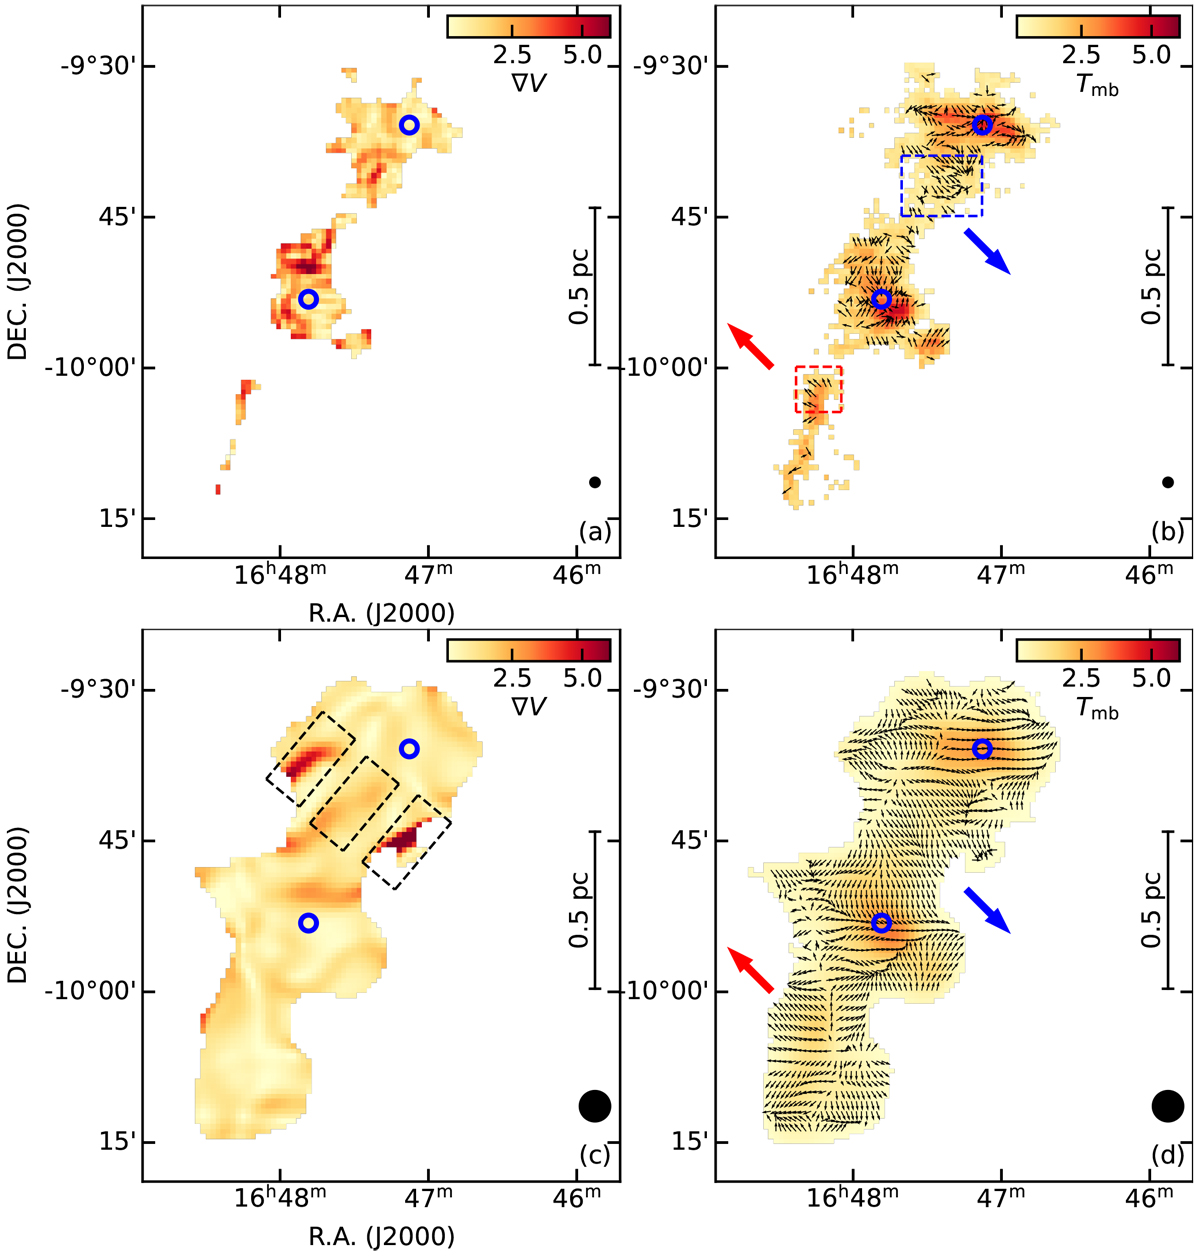
Distribution of local velocity gradients derived from C18O velocity centroids. (a) Local velocity gradient magnitude map derived from Fig. 5b. (b) C18O (J = 1 −0) peak intensity map is overlaid with the normalized velocity gradient vectors. The blue and red arrows represent the average directions of the local velocity gradients in sub-regions indicated by the blue and red dashed boxes, respectively. Figures 6c and d is similar to Figs. 6a and b, but derived from Fig. 5e. In Fig. 6c, the three regions showing high velocity gradients are indicated by the three black dashed boxes. In each panel, the beam size is shown in the lower right corner, the two Planck cold clumps (G008.67+22.14 and G008.52+21.84) are indicated by the two open blue circles.
Current usage metrics show cumulative count of Article Views (full-text article views including HTML views, PDF and ePub downloads, according to the available data) and Abstracts Views on Vision4Press platform.
Data correspond to usage on the plateform after 2015. The current usage metrics is available 48-96 hours after online publication and is updated daily on week days.
Initial download of the metrics may take a while.