Fig. 4
Download original image
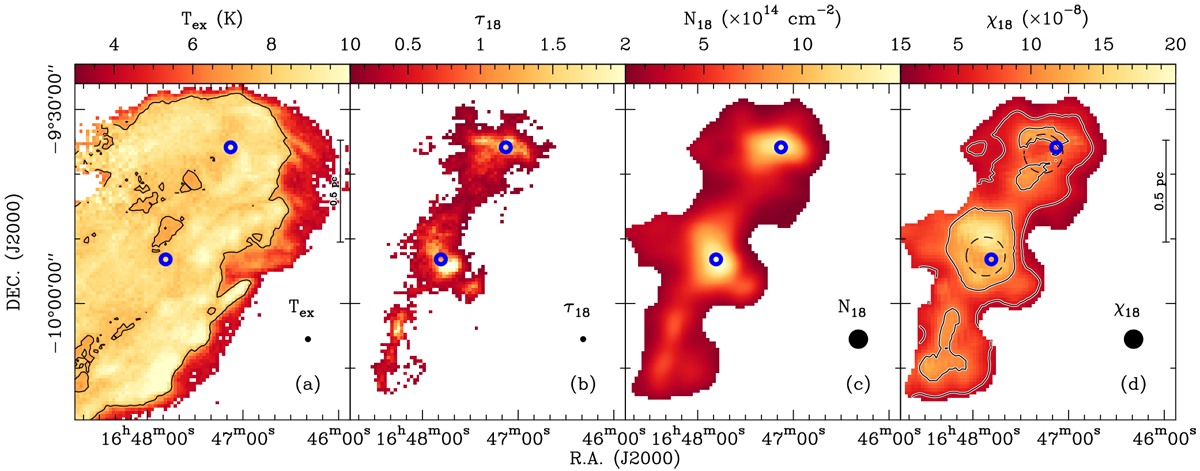
Distribution of the physical and chemical properties of C18O in Oph N l. (a) Excitation temperature map derived from the CO peak main beam temperature. The color bar represents the excitation temperature in units of K, while the contour represents an excitation temperature of 7.5 K. (b) Peak C18O (J = 1 −0) opacity map. (c) C18O column density map at an angular resolution of 3′ (d) C18O fractional abundance map. The contours represent the C18O fractional abundances of 5 × 10⁻⁸ and 1 × 10⁻⁷. The two dashed circles represent the observed CO depletion holes. In each panel, the beam size is shown in the lower right corner, the two Planck cold clumps (G008.67+22.14 and G008.52+21.84) are indicated by the two blue open circles.
Current usage metrics show cumulative count of Article Views (full-text article views including HTML views, PDF and ePub downloads, according to the available data) and Abstracts Views on Vision4Press platform.
Data correspond to usage on the plateform after 2015. The current usage metrics is available 48-96 hours after online publication and is updated daily on week days.
Initial download of the metrics may take a while.