Fig. 2
Download original image
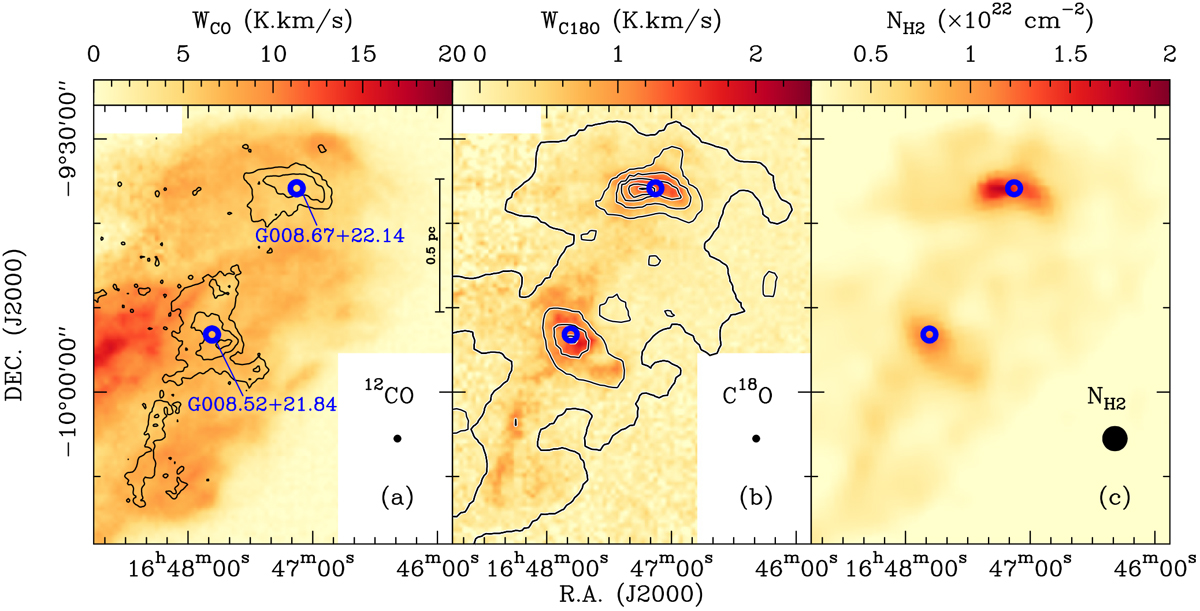
Distribution of CO, C18O and H2 gas. (a) CO (J = 1−0) integrated intensity map, Wco, is overlaid with the C18O (J= 1−0) integrated intensity contours. The integrated velocity ranges are [1.3, 6.1] km s−1 for CO (J = 1−0) and [2.5, 4.2] km s−1 for C18O (J= 1−0). The color bar represents the CO (J = 1−0) integrated intensity in units of Κ km s−1, while the contours start at 0.54 Κ km s−1 and increase by 0.54 Κ km s−1. (b) C18O (J = 1−0) integrated intensity map, ![]() is overlaid with the H2 column density black contours from the near infrared extinction map (Juvela & Montillaud b2016). The color bar represents the C18O (J = 1−0) integrated intensity in units of Κ km s−1. The black contours start at 3 × 1021 cm-2 and increase by 3 × 1021 cm-2, (c) Extinction-based H2 column density map. In each panel, the beam size is shown in the lower right corner, and the two Planck cold clumps are indicated by the two blue open circles.
is overlaid with the H2 column density black contours from the near infrared extinction map (Juvela & Montillaud b2016). The color bar represents the C18O (J = 1−0) integrated intensity in units of Κ km s−1. The black contours start at 3 × 1021 cm-2 and increase by 3 × 1021 cm-2, (c) Extinction-based H2 column density map. In each panel, the beam size is shown in the lower right corner, and the two Planck cold clumps are indicated by the two blue open circles.
Current usage metrics show cumulative count of Article Views (full-text article views including HTML views, PDF and ePub downloads, according to the available data) and Abstracts Views on Vision4Press platform.
Data correspond to usage on the plateform after 2015. The current usage metrics is available 48-96 hours after online publication and is updated daily on week days.
Initial download of the metrics may take a while.