Fig. A.1
Download original image
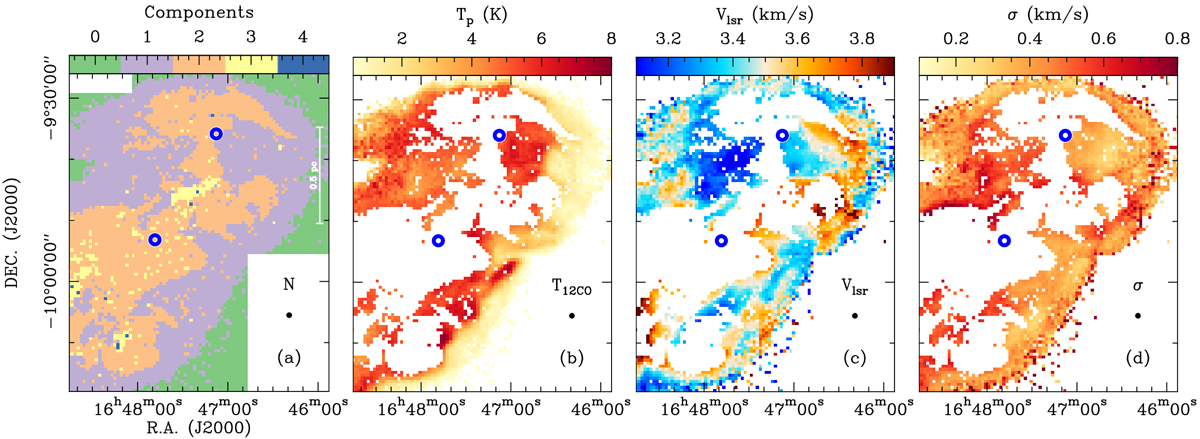
Decomposition of CO (J = 1 – 0) data (a) Distribution of the number of the fitted velocity components, (b) Fitted peak intensities for the pixels showing a single velocity component, (c) Fitted velocity centroids for the pixels showing a single velocity component, (d) Fitted velocity dispersions for the pixels showing a single velocity component. In each panel, the beam size is shown in the lower right corner, the two Planck cold clumps (G008.67+22.14 and G008.52+21.84) are indicated by the two open blue circles.)
Current usage metrics show cumulative count of Article Views (full-text article views including HTML views, PDF and ePub downloads, according to the available data) and Abstracts Views on Vision4Press platform.
Data correspond to usage on the plateform after 2015. The current usage metrics is available 48-96 hours after online publication and is updated daily on week days.
Initial download of the metrics may take a while.