Fig. 9
Download original image
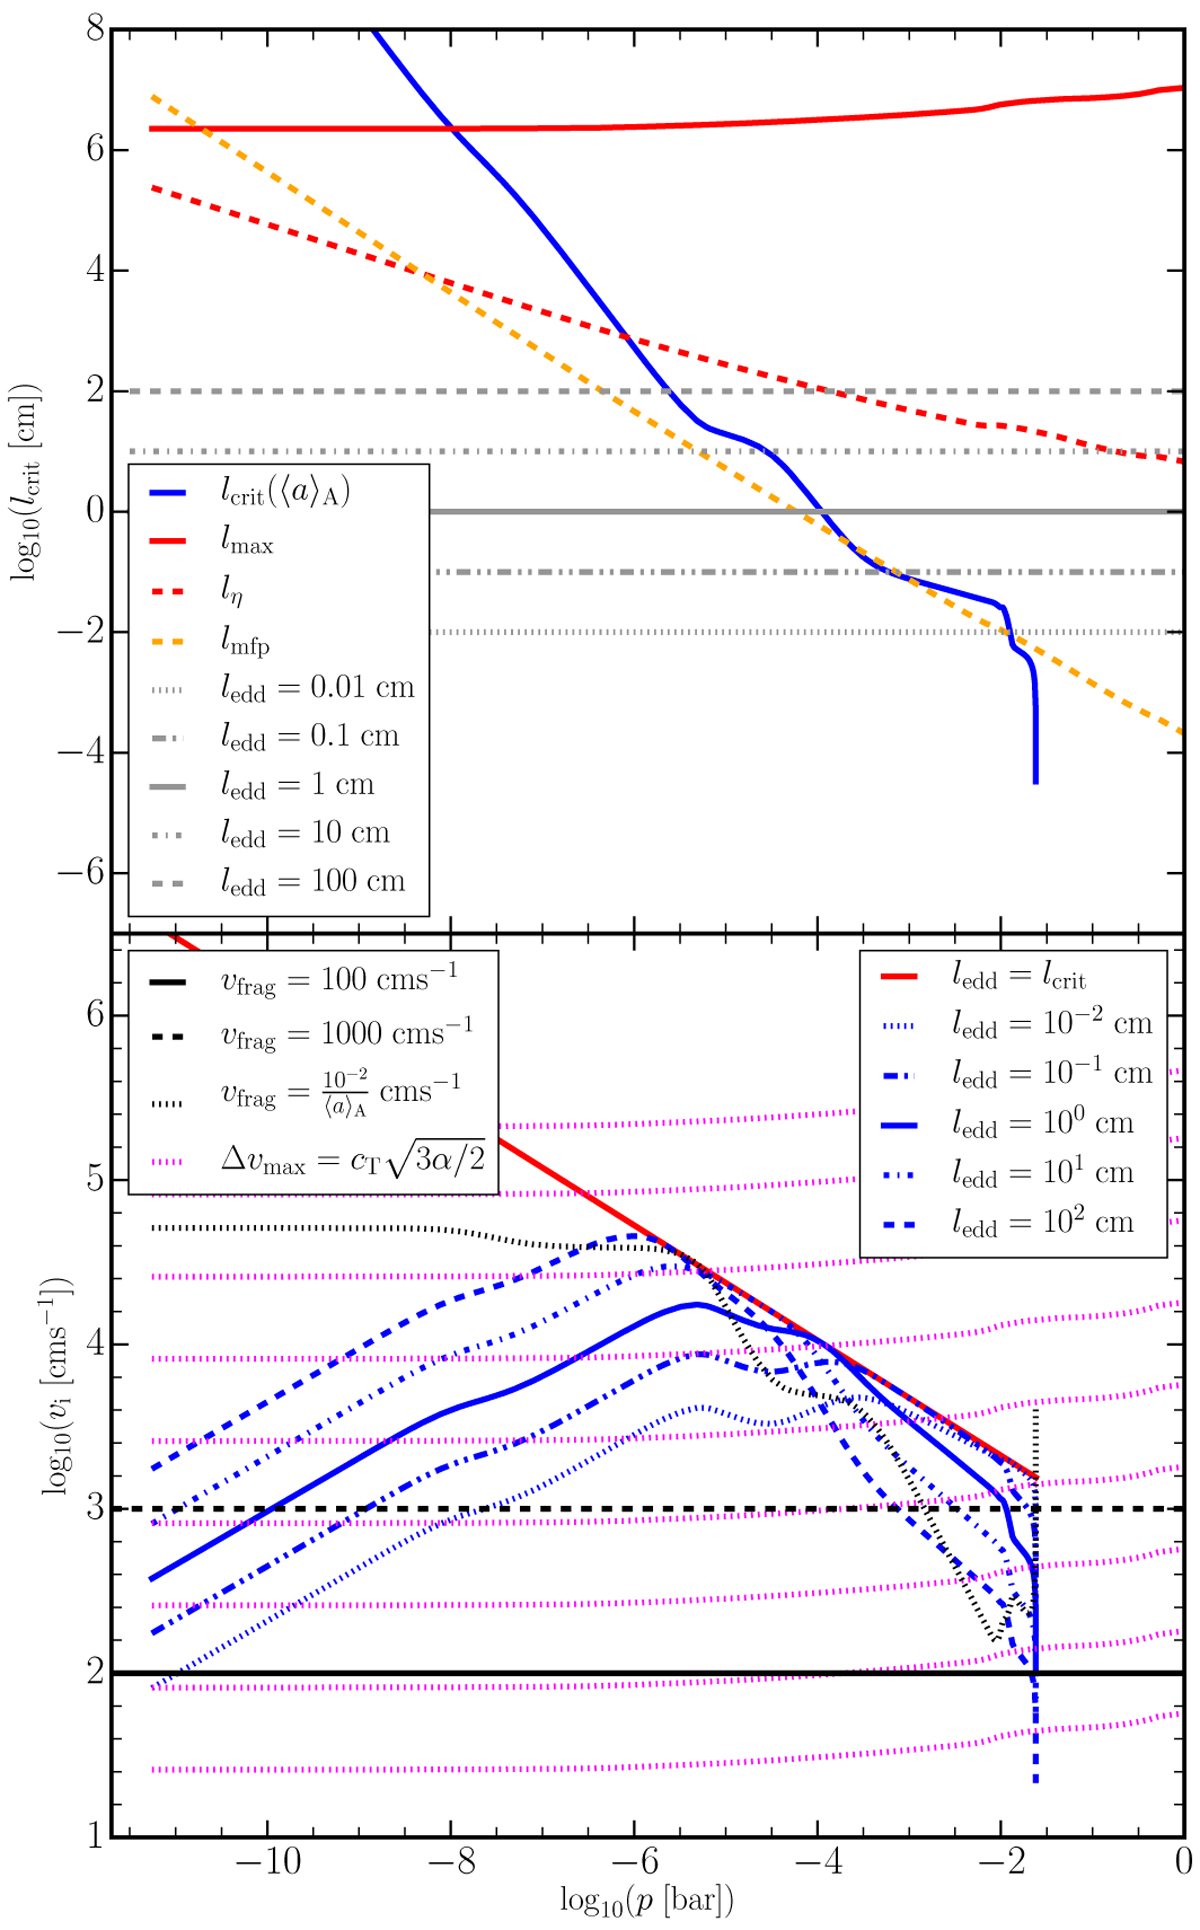
Comparison of turbulence parametrisation for different eddy size parameter sizes. Top: critical eddy size lcrit (blue) for cloud particles in the Teff = 1400 K, log10(ɡ [cms−2]) = 3.0 profile, without inclusion of collisions. The red lines show the maximum eddy size ![]() (solid) and the Kolmogorov scale
(solid) and the Kolmogorov scale ![]() (dashed). The mean free path (lmfp) of the gas is shown as the orange dashed line. Bottom: relative velocities that cloud particles would receive from turbulent eddies of the sizes ledd in the upper panel (blue). The fragmentation limits discussed in Sect. 3.4.2 are shown as black lines. The magenta dashed lines show the maximum relative velocity
(dashed). The mean free path (lmfp) of the gas is shown as the orange dashed line. Bottom: relative velocities that cloud particles would receive from turbulent eddies of the sizes ledd in the upper panel (blue). The fragmentation limits discussed in Sect. 3.4.2 are shown as black lines. The magenta dashed lines show the maximum relative velocity ![]() using the Shakura & Sunyaev (1976) turbulence α parametrisation, and maximum velocity from Ormel & Cuzzi (2007). The lowest line is α = 10−8 and the highest is a = 1, increments in orders of magnitude.
using the Shakura & Sunyaev (1976) turbulence α parametrisation, and maximum velocity from Ormel & Cuzzi (2007). The lowest line is α = 10−8 and the highest is a = 1, increments in orders of magnitude.
Current usage metrics show cumulative count of Article Views (full-text article views including HTML views, PDF and ePub downloads, according to the available data) and Abstracts Views on Vision4Press platform.
Data correspond to usage on the plateform after 2015. The current usage metrics is available 48-96 hours after online publication and is updated daily on week days.
Initial download of the metrics may take a while.