Fig. 8
Download original image
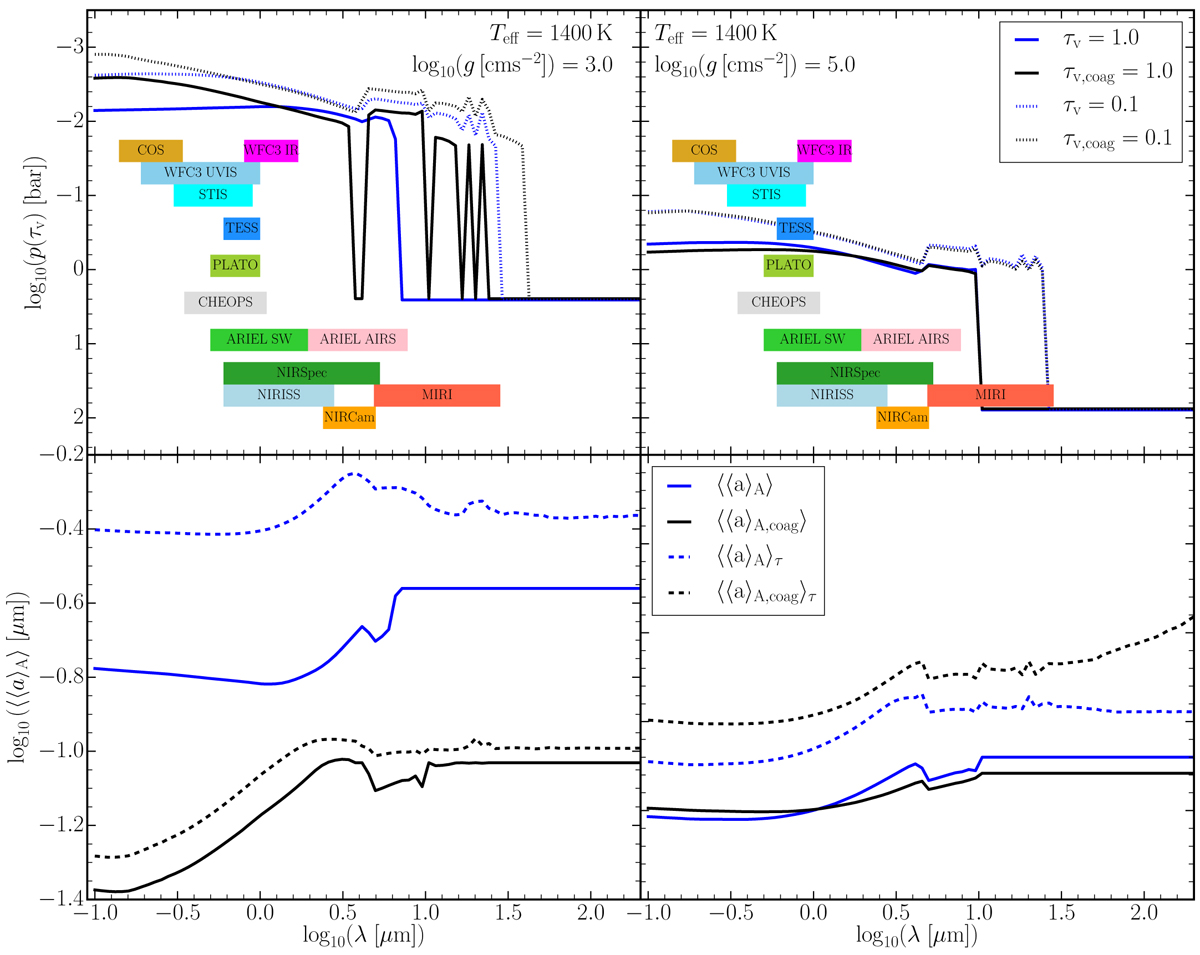
Results for Teff = 1400 K, log10(ɡ [cms−2]) = 3.0 (left), Teff = 1400 K, log10(ɡ [cms−2]) = 5.0 (right), without particle-particle collisions (blue) and with particle-particle collisions (black). Top: pressure level at which the cloud vertical optical depth reaches certain thresholds: p(τv = 1) in solid lines and p(τv = 0.1). Bottom: number density-weighted surface-averaged radius of the cloud particle population above the pressure level at which cloud optical depth reaches unity (〈〈a〉 A〉 , solid) and the average observable particle size (〈〈a〉A〉τ, dashed). The Hubble instrument wavelength ranges (from Wakeford et al. 2020) are shown as the coloured bars at the top left; the wavelengths for the Transiting Exoplanet Survey Satellite (TESS; Ricker et al. 2015), the CHaracterising ExOPlanets Satellite (CHEOPS; Broeg et al. 2013), and the PLAnetary Transits and Oscillations of stars mission (PLATO Rauer et al. 2014) are below. Shown as the ‘ARIEL SW’ bar are the VISPhot (0.5–0.6 µm), FGS1 (0.6–0.8 µm), and FGS2 (0.8–1 µm) photometers and the NIRSpec (1.1–1.95 µm) spectrometer wavelengths (Mugnai et al. 2020). The ARIEL Infrared Spectrometer (AIRS) is shown as the bar to the right of this. The JWST wavelength ranges are shown in the group of bars at the bottom.
Current usage metrics show cumulative count of Article Views (full-text article views including HTML views, PDF and ePub downloads, according to the available data) and Abstracts Views on Vision4Press platform.
Data correspond to usage on the plateform after 2015. The current usage metrics is available 48-96 hours after online publication and is updated daily on week days.
Initial download of the metrics may take a while.