Fig. 2
Download original image
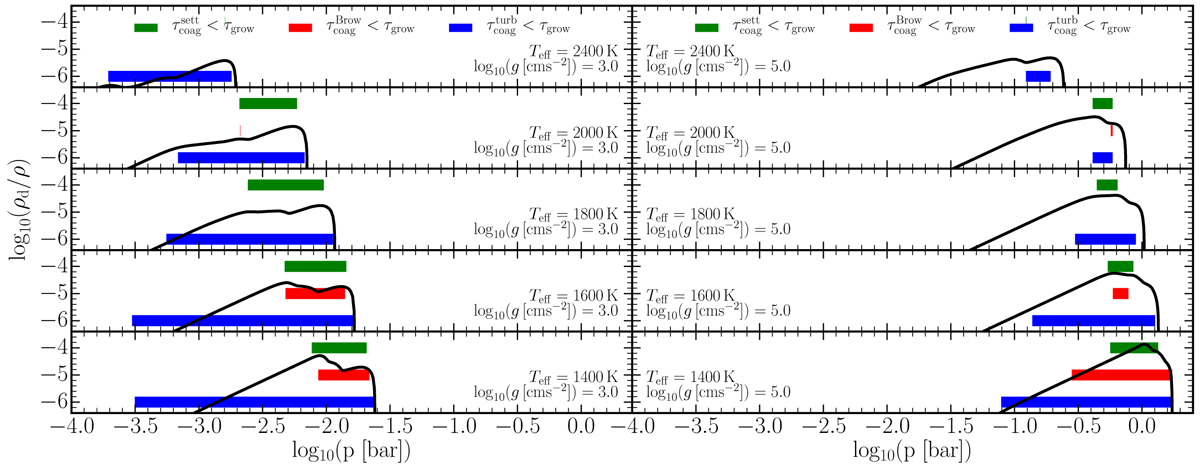
Atmosphere regions where particle–particle collisions are faster than the gas-solid surface growth process. Shown are results for three particle collision processes for different atmosphere structures: gravitational settling (green bar), Brownian motion (red bar), turbulence (blue bar). The black line shows the cloud particle mass load (ρd/ρ) at the different pressures for all DRIFT-PHOENIX atmospheric profiles used: Teff = 1400, 1600, 1800, 2000, 2400 K, for log10(ɡ [cm s−2]) = 3.0, 5.0 (left and right, respectively). The focus is only on the cloud base (10−4 < p bar < 100). The x-axis is zoomed in to show the cloud base.
Current usage metrics show cumulative count of Article Views (full-text article views including HTML views, PDF and ePub downloads, according to the available data) and Abstracts Views on Vision4Press platform.
Data correspond to usage on the plateform after 2015. The current usage metrics is available 48-96 hours after online publication and is updated daily on week days.
Initial download of the metrics may take a while.