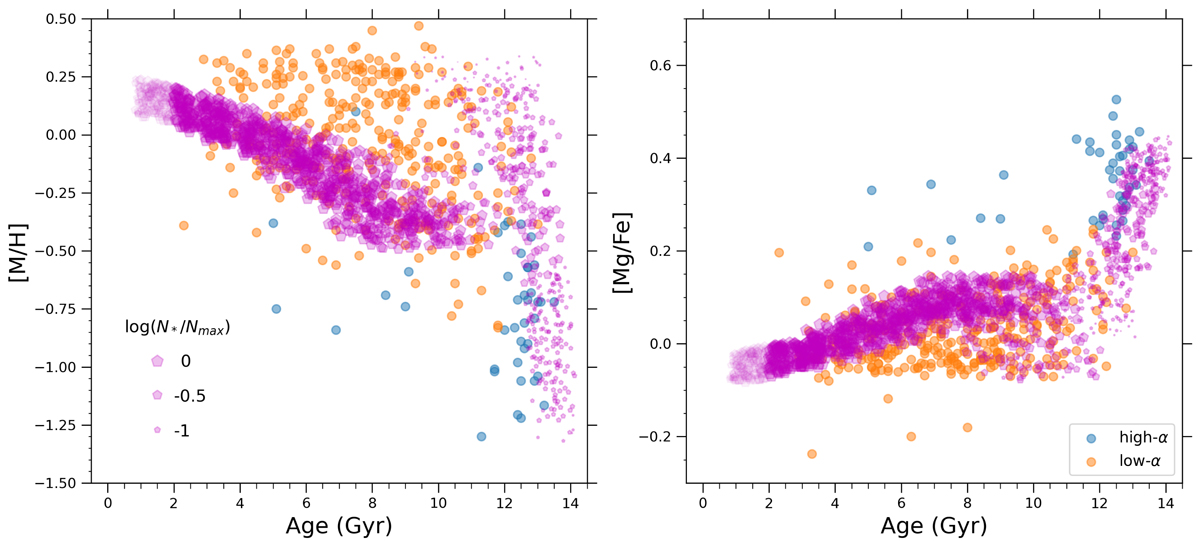
Fig. 8.
Download original image
Synthetic model results for the time evolution of [M/H] (left panel) and [Mg/Fe] (right panel) distributions produced by the delayed two-infall model in combination with the age and abundance uncertainties of the MSTO subsample (see Eqs. (10)–(12)). The stellar yields are from François et al. (2004). Purple filled pentagons are the mock data from the synthetic model. The pentagon size indicates the local number density of formed stars normalised to maximum value, taking into account the selection function. Pentagons with age below 2 Gyr are shaded due to the absence of stellar data in this region. The light blue points are the observed high-α stars, whereas the orange points are the observed low-α stars of the MSTO subsample.
Current usage metrics show cumulative count of Article Views (full-text article views including HTML views, PDF and ePub downloads, according to the available data) and Abstracts Views on Vision4Press platform.
Data correspond to usage on the plateform after 2015. The current usage metrics is available 48-96 hours after online publication and is updated daily on week days.
Initial download of the metrics may take a while.