Fig. 6.
Download original image
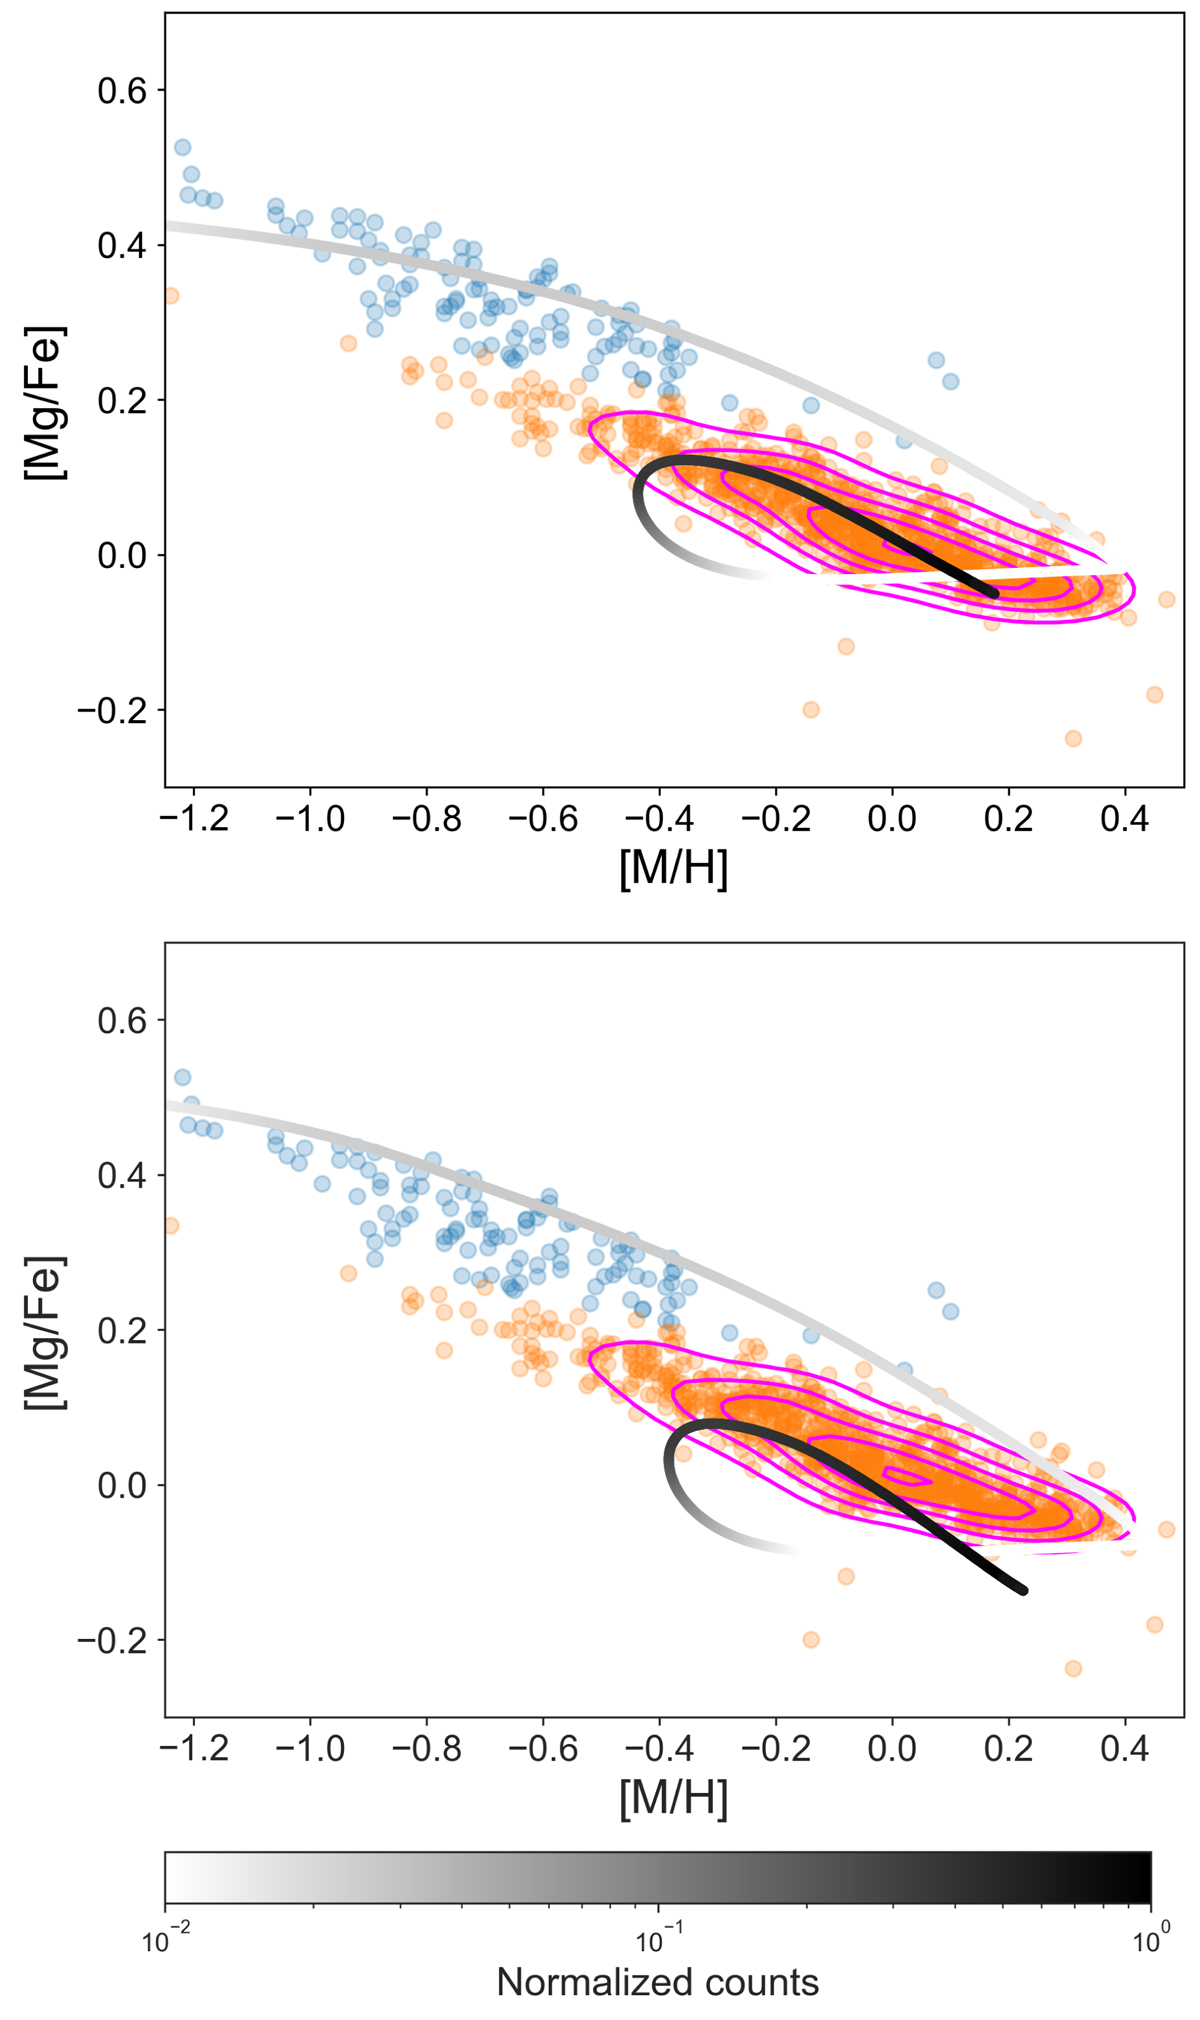
[Mg/Fe] vs. [M/H] abundance diagram for the delayed two-infall model scenario of chemical evolution with François et al. (2004) yields (upper panel) and Kobayashi et al. (2006) yields (lower panel). The colour bar indicates the predicted stellar number counts (normalised to the maximum value) at a certain point of the diagram, taking into account the selection function. The light blue points are the observed high-α stars, whereas the orange points are the observed low-α stars. The magenta contour lines enclose the observed density distribution of stars.
Current usage metrics show cumulative count of Article Views (full-text article views including HTML views, PDF and ePub downloads, according to the available data) and Abstracts Views on Vision4Press platform.
Data correspond to usage on the plateform after 2015. The current usage metrics is available 48-96 hours after online publication and is updated daily on week days.
Initial download of the metrics may take a while.