Open Access
Fig. 3.
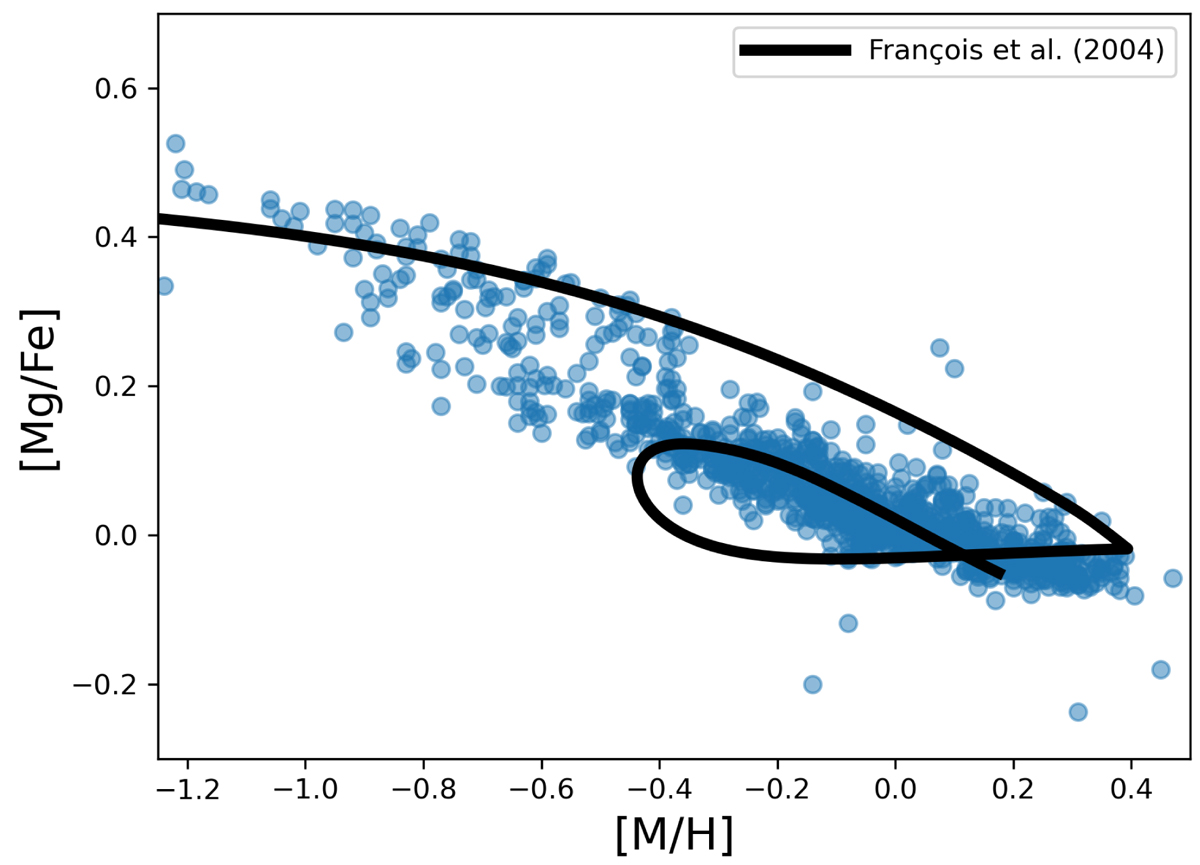
Download original image
[Mg/Fe] vs. [M/H] abundance diagram for the delayed two-infall model described in Sect. 3 adopting François et al. (2004) yields for massive stars. The blue points are the data from Santos-Peral et al. (2020, 2021).
Current usage metrics show cumulative count of Article Views (full-text article views including HTML views, PDF and ePub downloads, according to the available data) and Abstracts Views on Vision4Press platform.
Data correspond to usage on the plateform after 2015. The current usage metrics is available 48-96 hours after online publication and is updated daily on week days.
Initial download of the metrics may take a while.