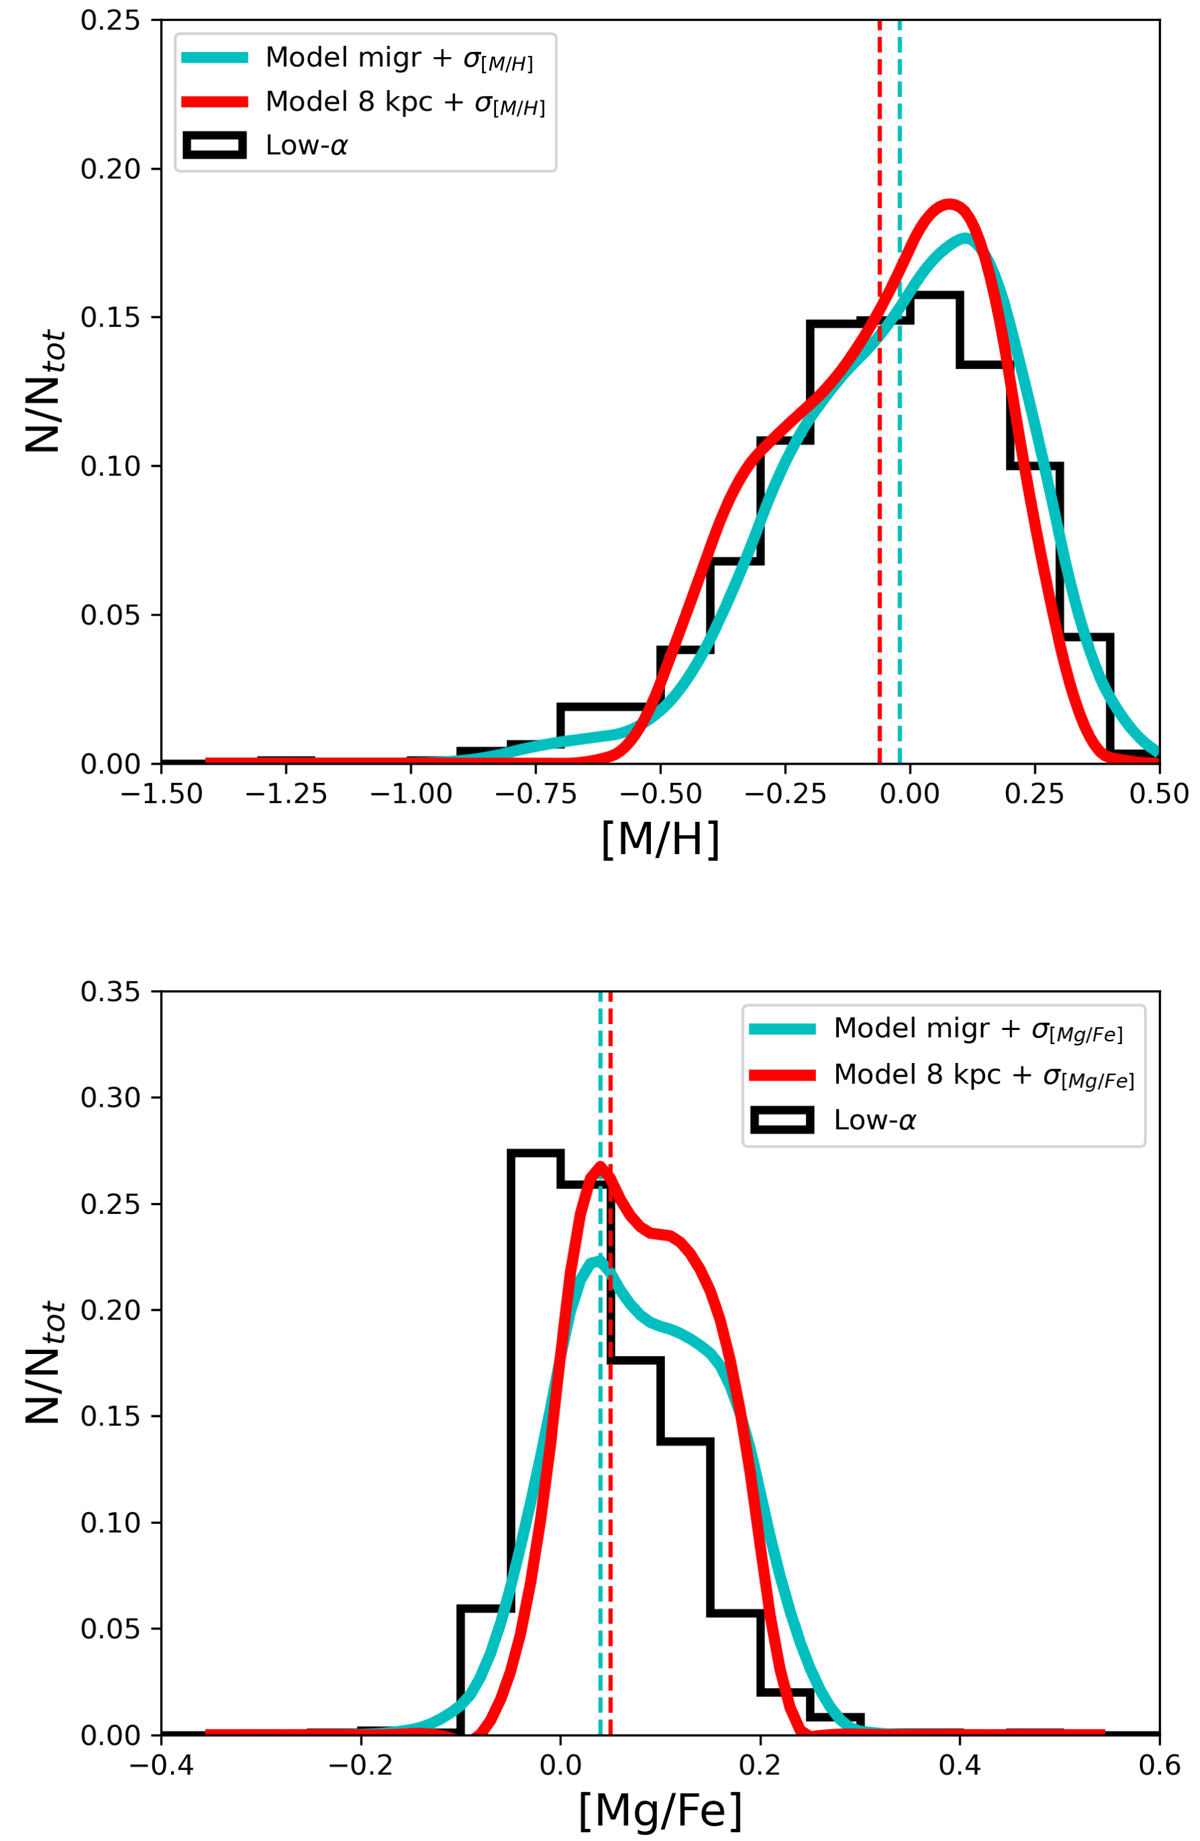
Fig. 16.
Download original image
[M/H] and [Mg/Fe] distribution functions observed for low-α stars (black histogram) compared with the theoretical functions for the two-infall model including migration prescriptions from Frankel et al. (2018) (cyan line) and no migration (red lines). The vertical dashed lines are the median [X/Y] ratios for models with migration (cyan) and without (red).
Current usage metrics show cumulative count of Article Views (full-text article views including HTML views, PDF and ePub downloads, according to the available data) and Abstracts Views on Vision4Press platform.
Data correspond to usage on the plateform after 2015. The current usage metrics is available 48-96 hours after online publication and is updated daily on week days.
Initial download of the metrics may take a while.