Fig. 8
Download original image
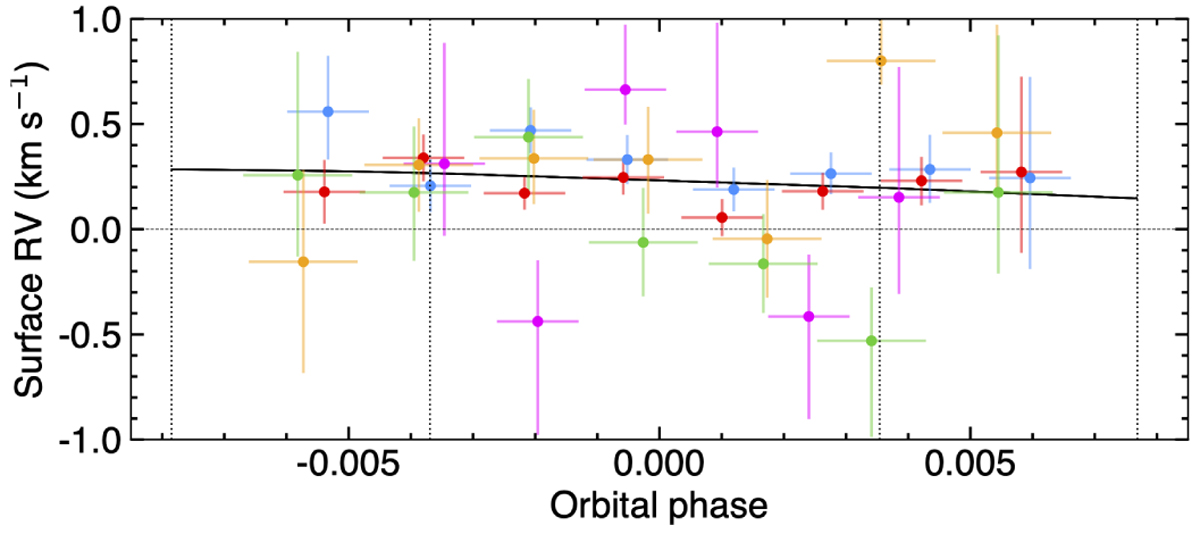
Stellar surface RVs of the regions occulted by GJ 436b in ESPRESSO visits 1 (blue) and 2 (red), HARPS Visit A (magenta), and HARPS-N visits B (orange) and C (green) derived from the fits to individual exposures (same details as Fig. 4). The solid black curve is the best-fit model derived from the joint Revolutions fit to all visits.
Current usage metrics show cumulative count of Article Views (full-text article views including HTML views, PDF and ePub downloads, according to the available data) and Abstracts Views on Vision4Press platform.
Data correspond to usage on the plateform after 2015. The current usage metrics is available 48-96 hours after online publication and is updated daily on week days.
Initial download of the metrics may take a while.