Fig. 7
Download original image
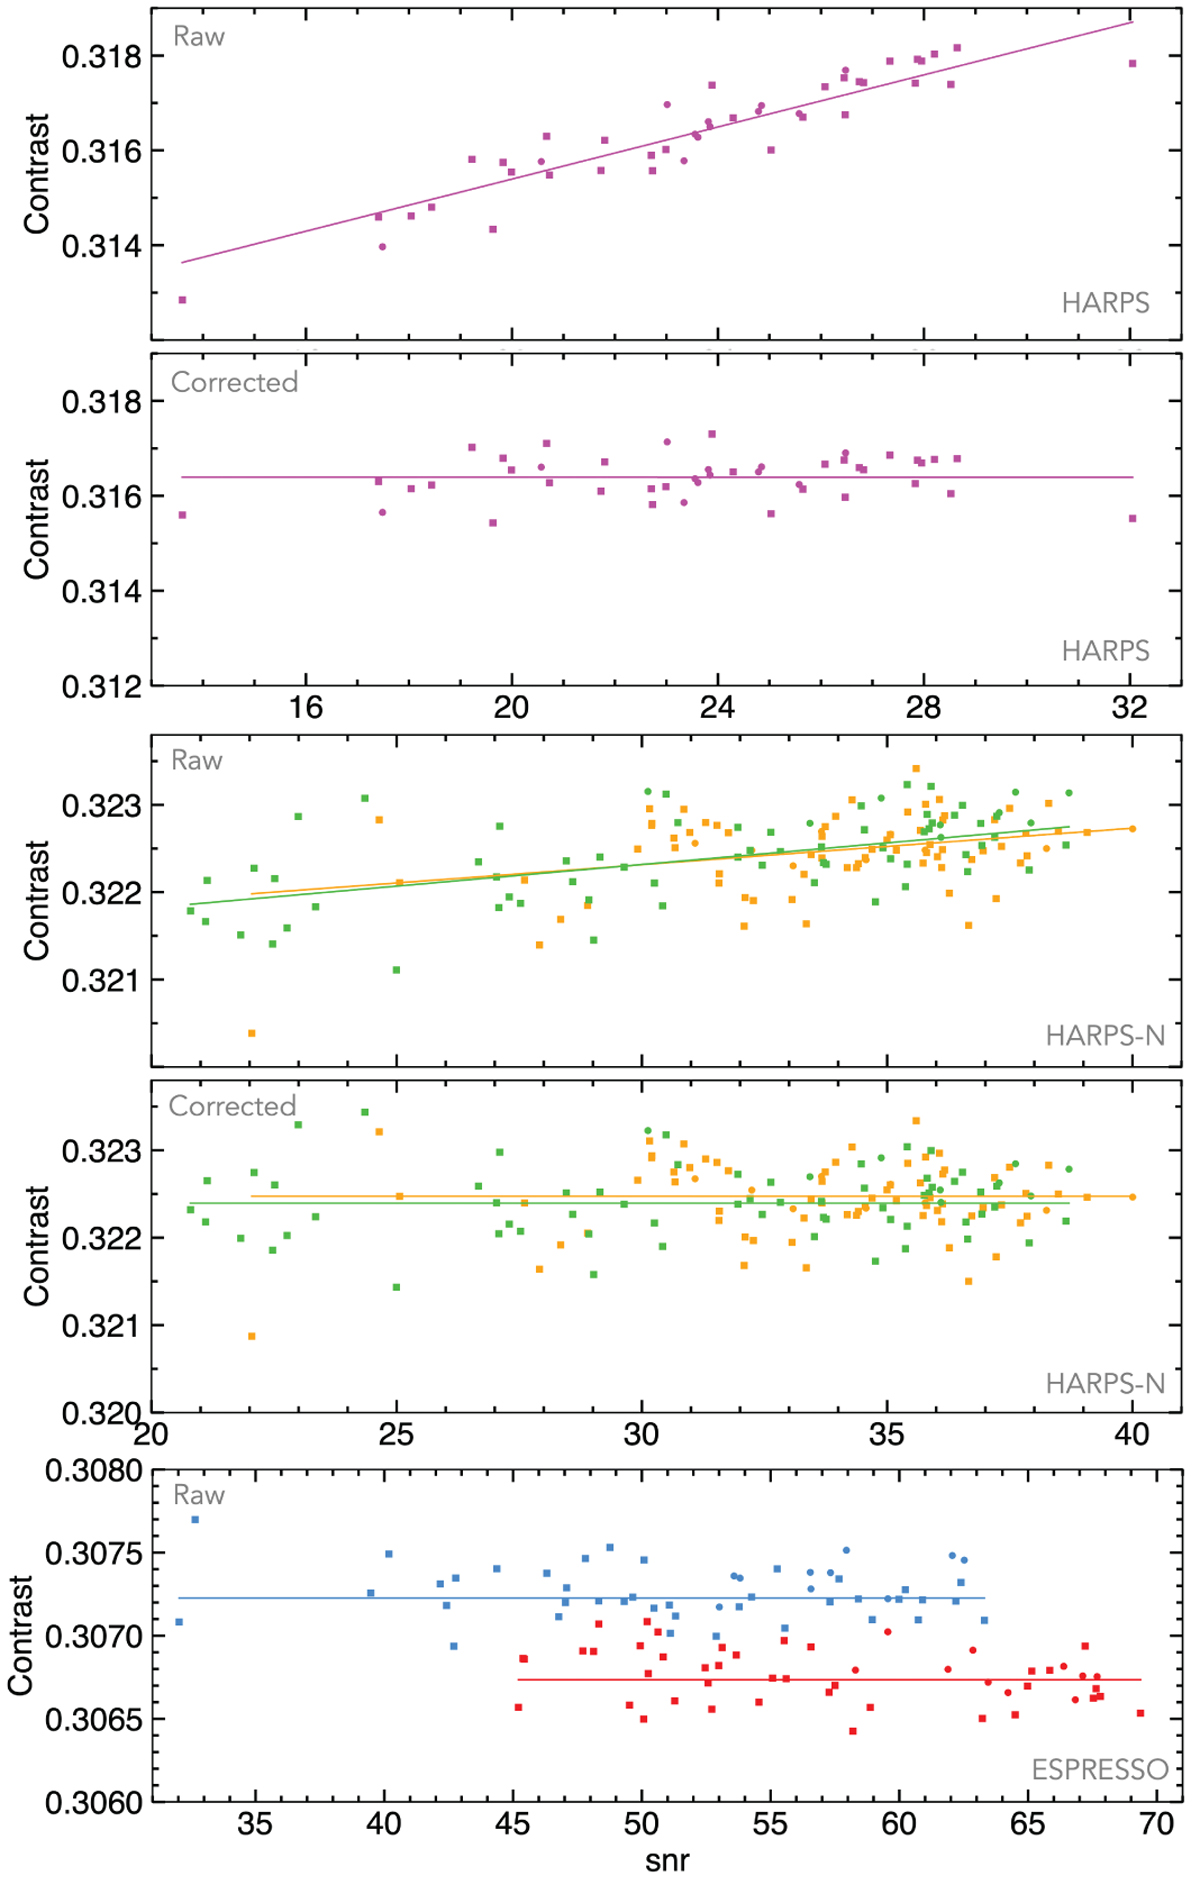
Contrast of the HARPS (magenta), HARPS-N (green and orange), and ESPRESSO (blue and red) CCFDI. HARPS/HARPS-N data are shown before (top panels) and after (bottom panels) correcting for their correlation with the S/N at 550 nm. Solid lines show best-fit models to the out-of-transit data (squares; in-transit points are shown as disks). Error bars are not shown for the sake of clarity.
Current usage metrics show cumulative count of Article Views (full-text article views including HTML views, PDF and ePub downloads, according to the available data) and Abstracts Views on Vision4Press platform.
Data correspond to usage on the plateform after 2015. The current usage metrics is available 48-96 hours after online publication and is updated daily on week days.
Initial download of the metrics may take a while.