Fig. 3
Download original image
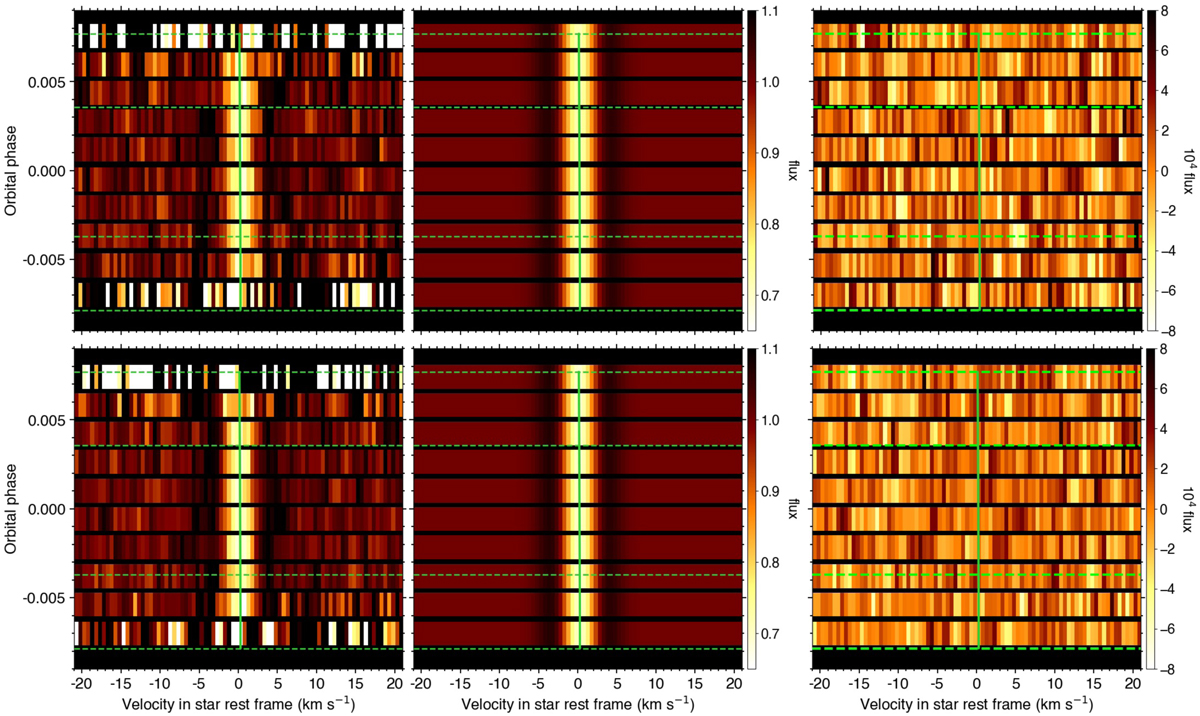
Maps of the CCFintr during the transit of GJ 436b in Visits 1 (upper panel) and 2 (lower panel). Left panels show measured profiles. The core of the stellar line from the planet-occulted regions is clearly visible as a bright streak, with side lobes visible on both sides as dark streaks. Middle panels show the RM Revolutions best-fit profiles. Right panels show residuals between measured and theoretical profiles. Transit contacts are shown as green dashed lines. Values are colored as a function of the flux, and plotted as a function of RV in the star rest frame (in abscissa) and orbital phase (in ordinate). The green solid line shows the stellar surface RV model from the RM Revolutions best fit.
Current usage metrics show cumulative count of Article Views (full-text article views including HTML views, PDF and ePub downloads, according to the available data) and Abstracts Views on Vision4Press platform.
Data correspond to usage on the plateform after 2015. The current usage metrics is available 48-96 hours after online publication and is updated daily on week days.
Initial download of the metrics may take a while.